Turn on suggestions
Auto-suggest helps you quickly narrow down your search results by suggesting possible matches as you type.
Cancel
- Home
- :
- All Communities
- :
- Products
- :
- ArcGIS Viewer for Flex (Retired)
- :
- ArcGIS Viewer for Flex Questions
- :
- Chart Widget
Options
- Subscribe to RSS Feed
- Mark Topic as New
- Mark Topic as Read
- Float this Topic for Current User
- Bookmark
- Subscribe
- Mute
- Printer Friendly Page
Chart Widget
Subscribe
5093
8
12-14-2012 08:56 AM
12-14-2012
08:56 AM
- Mark as New
- Bookmark
- Subscribe
- Mute
- Subscribe to RSS Feed
- Permalink
I am using OTB chart widget and would like to be able to summarize the different types of pipe material in the pie chart. For example ac, ci, di, pvc. This is what I have so far:
<configuration>
<labels>
<layerselectionlabel>Select layer</layerselectionlabel>
<drawtoolmenulabel>Select draw tool</drawtoolmenulabel>
</labels>
<layers>
<layer label="Water Pipe Material" url="http://wr_modeling/ArcGIS/rest/services/UtilitiesDashboard/MapServer/12">
<labelfield>MATERIAL</labelfield>
<fields>
<field name="MATERIAL"/>
<field name="SHAPE_LEN"/>
</fields>
<medias>
<media chartfields="SHAPE_LEN"
title="Length of Pipe Material"
type="piechart"/>
</medias>
</layer>
</layers>
</configuration>
8 Replies
03-08-2013
07:56 AM
- Mark as New
- Bookmark
- Subscribe
- Mute
- Subscribe to RSS Feed
- Permalink
Did you ever make progress on this, I have a similar issue on the forum...
03-14-2013
05:48 AM
- Mark as New
- Bookmark
- Subscribe
- Mute
- Subscribe to RSS Feed
- Permalink
Did you ever make progress on this, I have a similar issue on the forum...
No I did not.
03-14-2013
08:32 AM
- Mark as New
- Bookmark
- Subscribe
- Mute
- Subscribe to RSS Feed
- Permalink
So, what are you getting that isn't what you want?
If I use the same config that you have, I get all the pipes, summarized by type, and shows percentage of that type as well as total length for that type pipe.
So, what specifically do you want when you say summarized by different types of pipe material?
R_
If I use the same config that you have, I get all the pipes, summarized by type, and shows percentage of that type as well as total length for that type pipe.
So, what specifically do you want when you say summarized by different types of pipe material?
R_
03-15-2013
04:07 AM
- Mark as New
- Bookmark
- Subscribe
- Mute
- Subscribe to RSS Feed
- Permalink
Thank for showing interest. Say I select 50 water pipe segments. Of those 50 I have 25 segments of CI material and 25 segments of PVC material. I would like the chart to say 50% AC with a total of 225' and 50% CI with a total of 325'. Instead the chart depicts each pipe segment separately. I hope I am explaining this clearly enough. Thanks.
03-18-2013
08:10 AM
- Mark as New
- Bookmark
- Subscribe
- Mute
- Subscribe to RSS Feed
- Permalink
If I use this for my config:
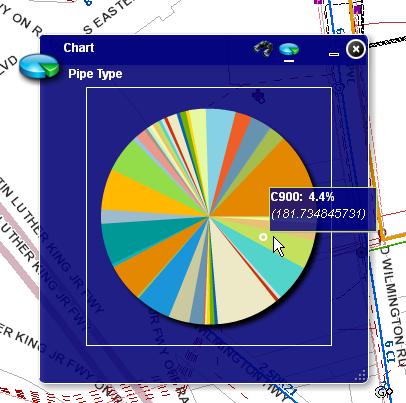
I will get this if I select a group of pipes:
[ATTACH=CONFIG]22699[/ATTACH][ATTACH=CONFIG]22700[/ATTACH]
So, if I hover over the results, it reports it as percentage of pipes by material, and also adds the total length.
R_
<configuration label="Charts (example)">
    <highlightcolor>0x336699</highlightcolor>
    <layers>

        <layer label="Pipe Size" url="http://gis01.wch-rcc.com/ArcGIS/rest/services/rkz/chart/MapServer/0">
            <labelfield>MATERIAL</labelfield>
            <fields>
                <field name="MATERIAL"/>
                <field name="Shape_Length"/>
            </fields>
            <medias>
                <media chartfields="Shape_Length"
                       title="Pipe Type"
                       type="piechart"/>
            </medias>
        </layer>

    </layers>
</configuration>
I will get this if I select a group of pipes:
[ATTACH=CONFIG]22699[/ATTACH][ATTACH=CONFIG]22700[/ATTACH]
So, if I hover over the results, it reports it as percentage of pipes by material, and also adds the total length.
R_
03-18-2013
10:55 AM
- Mark as New
- Bookmark
- Subscribe
- Mute
- Subscribe to RSS Feed
- Permalink
[ATTACH=CONFIG]22706[/ATTACH][ATTACH=CONFIG]22707[/ATTACH]
R_,
I have attached examples of what I end up. Individual line totals. I am using a dynamic map service...could this be the problem?
<configuration label="Charts (example)">
<highlightcolor>0x336699</highlightcolor>
<layers>
<layer label="Pipe statistics" url="http://wr_modeling/ArcGIS/rest/services/UtilitiesDashboard/MapServer/12">
<labelfield>MATERIAL</labelfield>
<fields>
<field name="MATERIAL"/>
<field name="SHAPE_LEN"/>
</fields>
<medias>
<media chartfields="SHAPE_LEN"
title="Pipe Type"
type="piechart"/>
</medias>
</layer>
</layers>
</configuration>
03-18-2013
11:07 AM
- Mark as New
- Bookmark
- Subscribe
- Mute
- Subscribe to RSS Feed
- Permalink
I use pretty much entirely dynamic services in my main config, so it is not that, especially since it's loaded in as a type feature (the /12 at the end of URL) in the chartwidget.xml.
What is C900 (the value reported in your chart), is that a line "type"? What field is it coming from?
Also, take a look at your rest services and make sure you have the correct values for MATERIAL and SHAPE_LEN and make sure you have the case correctly. Don't know what server version you are running, but know there have been some changes. In 10.05 the shape length field is actually Shape_Length.
R_
08-20-2013
08:43 AM
- Mark as New
- Bookmark
- Subscribe
- Mute
- Subscribe to RSS Feed
- Permalink
I am having a similar problem. I want to see a pie chart showing the percentage of selected line segments in each CCOL1_1 category (in the preceding example above, s/he wanted them classed by Material). My chart seems to show every single line segment as an individual 'slice of pie' rather than the total segments. This is my first time attempting the chart widget. Thanks for any help!
<?xml version="1.0" ?>
<configuration>
    <highlightcolor>0</highlightcolor>
    <labels>
        <layerselectionlabel>Select layer</layerselectionlabel>
        <drawtoolmenulabel>Select draw tool</drawtoolmenulabel>
    </labels>
    <layers>
        <layer label="Erosion Hazards test" url="http://olga.er.usgs.gov/stpgis/rest/services/Vulnerability/ALL_erosion_hazards_test/MapServer/0">
            <labelfield>CCOL1_1</labelfield>
            <fields>
                <field name="CCOL1_1"/>
                <field name="SHAPE.LEN"/>
            </fields>
            <medias>
                <media chartfields="SHAPE.LEN" title="COL1 Example" type="piechart"/>
            </medias>
        </layer>
    </layers>
</configuration>