ArcGIS Tutorials Blog - Page 6

cancel
Showing results for 
Show  only  | Search instead for 
Did you mean: 

Latest Activity

(94 Posts)
SilpaGadi
Esri Contributor

New Learn Lessons
 
A Learn Lesson is a step-by-step tutorial that uses a real-world scenario to introduce key ArcGIS tools and workflows. Here's a roundup of new lessons in the Learn ArcGIS Gallery that have appeared in the last month.
 
Borrow attributes with a spatial join (ArcGIS Pro Basic)
 spatialjoin.png
Join the attributes from one layer to another based on common locations rather than common fields.


Convert text data to numeric data (ArcGIS Pro Basic)
converttext.png

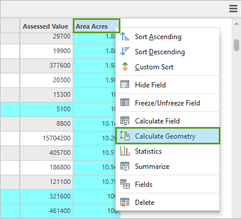
In this lesson, you'll create new numeric fields and populate them with the data from the text fields. You'll learn how to choose a field type and how to calculate fields.


Create a social equity index to improve public health (ArcGIS Pro)
socialequity.png

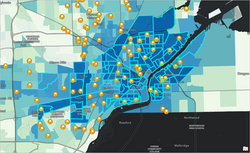
In this lesson, you are a GIS analyst tasked by your organization with improving respiratory health by identifying the areas in your community that would most benefit from increased funding for respiratory health educational programs, at-home air filtration systems, and other interventions to reduce and manage childhood asthma rates. To accomplish this, you will create a social equity index map that ranks each census block group in Lucas County, Ohio, in order of priority, based on 12 of the demographic indicators identified in collaboration with local residents. The resulting map with this index would help decision makers find locations where additional resource allocation would have the highest impact.


Customize a climate resilience index (ArcGIS Online)
resilience.png

In this lesson, you are a resilience planner for Miami-Dade County in Florida looking for ways to address extreme heat in your community. One of several options, or interventions, you will consider is opening cooling centers. Cooling centers are public spaces in the community with air conditioning, cold water, and other amenities that offer protection against the health effects of extreme heat. To meet city goals, you want to understand where cooling centers should be located to support the most vulnerable and historically underserved communities in the county.


Copy features between layers (ArcGIS Pro Basic)
copy features.png

In this lesson, you have a layer of building footprints for a neighborhood in Boulder, Colorado, U.S.A. The layer is missing some buildings, so you'll copy and paste features from another layer. You'll learn how to use some of the ArcGIS Pro editing tools, including Paste Special and the Attributes pane.


Run geoprocessing tools with Python(ArcGIS Pro)
geoprocessing.pngRunning a geoprocessing tool in Python requires a good understanding of the tool’s syntax, including both required and optional parameters. In this lesson, you will practice running geoprocessing tools in the Python window. This lesson will demonstrate how to write Python code with correct syntax to run geoprocessing tools.


more
0 0 464
RebekaAlvarez-Heck
Esri Contributor

We wanted to take a minute to highlight our team’s favorite lessons.

Read more...

more
3 1 719
RebekaAlvarez-Heck
Esri Contributor

The 2022 Esri User Conference is right around the corner, and we wanted to take a minute to highlight lessons from Learn ArcGIS. These lessons reflect some of the topics that will be covered at Esri’s 2022 User Conference.

Read more...

more
1 0 324
SilpaGadi
Esri Contributor

New Learn Lessons
 
A Learn Lesson is a step-by-step tutorial that uses a real-world scenario to introduce key ArcGIS tools and workflows. Here's a roundup of new lessons in the Learn ArcGIS Gallery that have appeared in the last month.
 
Extract 3D buildings using photogrammetry (ArcGIS Pro Advanced)
3d building.png

In this lesson, as a GIS analyst working for the City of Pleasanton, California's Appraisal Department, you have been asked to take the existing building footprints for a local subdivision and turn them into 3D models with accurate heights and correctly shaped roofs. Additionally, each building is required to have attribution that records the building height and roof characteristics. Not only is the 3D attribute information valuable for appraisers, it can be used for a variety of use cases across the government enterprise in emergency management, facility management, planning, and Building Information Modeling (BIM).


Share digital building models in 3D web scenes (ArcGIS Pro)
3d web scenes.png

In this lesson, you will focus on the De Zalmhaven building complex being planned in the city of Rotterdam, Netherlands. You'll prepare and share a 3D scene showcasing that project. In the process, you'll learn about two sharing methods that offer different capabilities. The result will be two different 3D web scenes that can be browsed in a web browser and can easily reach their targeted audience. This approach seamlessly integrates digital building models developed with BIM software into 3D scenes produced with ArcGIS Pro and ArcGIS Online.


Clip features to a region (ArcGIS Pro Basic)
clip features.png

You are compiling data for a conservation analysis of Honduras. You found a layer representing terrestrial ecoregions, however, the layer covers the entire world, and all of your other layers are confined to Honduras. You'll make a copy of this layer that is clipped to the border of the country. You'll also add metadata so you can trace the clipped layer back to its source.


Fix data when it appears in the wrong place (ArcGIS Pro Basic)
fix data.png

A colleague sent you some spatial data for a flood mapping project you are working on in England. Unfortunately, when you add the data to a map, it appears in the wrong part of the world. When data appears in the wrong location, it usually means that the coordinate system is not defined, or it is defined incorrectly. When this occurs, you must do some research to find the name of the correct coordinate system. In this lesson, you'll learn how to use the Define Projection tool to align data to the correct geographic location.


Get started with ArcGIS for Excel (ArcGIS Online, Microsoft 365
ArcGIS for Excel)
excel.pngArcGIS for Excel adds a geographic component to the data analysis capabilities of Microsoft Office. In this lesson, you'll create a map in Microsoft Excel based on a spreadsheet of potential customers for a beauty salon in Ottawa, Canada. By putting information about the salon locations and customers on a map, you can perform a visual analysis of leads generated at the Women’s Show, a major consumer event for women in Canada.


New Learn Paths

A Learn Path is sequenced set of resources for learning about a particular topic. Here's a roundup of some new paths in the Learn ArcGIS Gallery that have appeared in the last month. 

 
Modern GIS - Mapping and Cartography 
path - modern GIS.PNGLearn how to make stunning maps to show off your data in the best way possible.


Modern GIS - Sharing & Presenting Spatial Information 
path - modern GIS spatial.PNGLearn ways to manage data and share your maps and apps so that others can use them.


Modern GIS - Introduction to GIS 
path3 - intro to GIS.PNGDiscover the foundational concepts and capabilities of GIS and how it is used to help solve world problems.
 

more
2 0 419
AngelaDuran
Esri Contributor

Learn ArcGIS provides story-driven exercises and activities to solve real-world problems using ArcGIS. From early adopters to university students and faculty, GIS professionals to data scientists, government workers to individuals contributing to their local communities.

Since Spring 2022, the Learn ArcGIS team released 16 new lessons and updated over 150 existing lessons.


climate-change-mitigation-st-bg.jpg


These new lessons cover a range of topics, such as Identify infrastructure at risk of landslides, Geolocate a 3D digital building model, Get started with ArcGIS for SharePointVisualize an ocean canyon in 2D and 3D, and Get started with Map Viewer Classic. For additional lessons, check out the Learn ArcGIS content library.


New Features!

  1. Learn ArcGIS will update lessons to include a feature on the level of difficulty for beginner, intermediate, or advanced.
  2. For all educational purposes, you are free to use, share, and adapt the Learn ArcGIS content with our creative commons. Please refer to our Terms of Use.

Coming Soon!

  1. Learn ArcGIS is in the process of working on an optional button to print the lesson in PDF format.
  2. Teach with GIS is undergoing a refresher as we work on building the content library.

To view our monthly Learn ArcGIS lesson releases, subscribe to our Learn ArcGIS Community.

If you have additional ideas for the Learn ArcGIS team, please share them in the Learn ArcGIS Community.


more
2 0 412
Nerrissa
Esri Contributor

Nerrissa_8-1654790845157.gif


World Oceans Day


June 8 marks World Ocean Day. Join us in celebrating our oceans by using GIS to map and visualize ocean data.  


Nerrissa_5-1654790004768.pngNo dumping - Drains to ocean 

In this lesson, you'll learn how to trace water flows from land-locked areas to salt water, in order to understand ways to prevent waste in the ocean.  


Nerrissa_6-1654790063610.png

Find fish in the Bering Sea 

In this lesson, you’ll use different interpolation methods to predict ocean temperatures. 


Nerrissa_7-1654790117404.png

Visualize an ocean canyon in 2D and 3D 

In this lesson, you'll take measurements of bathymetric terrain in both 2D and 3D.  


View all oceanography lessons: See all of the lessons that work with ocean data and conservation.  


Enjoy these Learn ArcGIS lessons, and let us know of any workflows you have for protecting our oceans by contacting us at  LearnArcGISSupport@esri.com 

more
0 0 445
AdenaSchutzberg1
Esri Regular Contributor

New Learn Lessons
 
A Learn Lesson is a step-by-step tutorial that uses a real-world scenario to introduce key ArcGIS tools and workflows. Here's a roundup of new lessons in the Learn ArcGIS Gallery that have appeared in the last month.
 
Import and incorporate 3D models in a scene (ArcGIS Pro)
import_3D.png

In this lesson, as the construction manager working you will go through the process of importing 3D content such as Khronos Group’s Graphics Language Transmission Format models (.gltf or .glb) into feature classes and placing them in a scene, as well as importing CAD files (.rvt) into ArcGIS Pro as a data source and 3D georeferencing them into 3D scenes.


Geolocate a 3D digital building model (ArcGIS Pro)
geolocate_building.png

In this lesson, as the construction manager working on the De Zalmhaven complex project in Rotterdam, Netherlands, you will geolocate a digital model representing a high-rise building and integrate it into a 3D scene representing the city center of Rotterdam.


Select and extract a subset of features (ArcGIS Pro)
extract_subset.png

You are making a map of South Africa. You found two layers that are useful to this project: one representing provinces and another representing urban areas. However, both layers are global in extent: they cover the entire world. You need to extract a subset of each layer that contains features only within South Africa. You'll accomplish this with three tools: Select by Attributes, Select by Location, and Export Features.


Merge multiple layers into one (ArcGIS Pro)
merge_multiple.png

A common data management task in GIS is to merge a set of separate layers into one. In this lesson, you have two polygon layers representing land areas in Norway. One is a general land layer, while the other maps only minor islands. You'll use the Merge geoprocessing tool to combine these two layers into a new dataset.

The Merge tool can be used with only a few clicks. However, in this case, some extra care is needed to ensure that the fields of the two input layers are merged correctly in the output layer. You'll learn how to configure a field map and resolve field mapping errors.


Get started with ArcGIS for SharePoint (ArcGIS Online, Microsoft SharePoint Online
ArcGIS for SharePoint)
start_sharepoint.pngIn this lesson, you'll first upload residential zoning files to your SharePoint site and add spatial data about zoning using ArcGIS for SharePoint. Then, you'll geotag files to their related spatial features and use geosearch to find the files on the map. You'll also create infographics and perform analysis using the data. Lastly, you'll share the results to collaborate with others in your organization.


New Learn Paths

A Learn Path is sequenced set of resources for learning about a particular topic. Here's a roundup of some new paths in the Learn ArcGIS Gallery that have appeared in the last month. 

 
Spatio-temporal analysis of COVID-19 daily confirmed cases 
spatio_temp_COVID.pngThese presentations were originally given at a workshop in partnership with University Consortium for Geographic Information Science (ucgis.org).


BIM and GIS 
BIM_CAD.pngCombine 3D BIM models used in the architecture, engineering, and construction (AEC) industry with the power of GIS and location intelligence technologies.
 

more
3 0 653
Nerrissa
Esri Contributor

Endangered Species Day


Today marks Endangered Species Day. Join us in bringing awareness to solutions to protect endangered species around the world.

What are endangered species? Any animal or organism that is threatened by extinction. Species can become endangered for many reasons including the loss of habitat, poaching, climate change, and invasive species.

Check out the following Learn ArcGIS lessons that use location analysis to study endangered species:

Nerrissa_2-1653069077577.png

Predict coral bleaching events

In this Learn lesson, you will determine which reefs are in danger of coral bleaching due to increased water temperatures.


Nerrissa_1-1653068584408.png

Build a model to connect mountain lion habitat

In this Learn lesson, you will determine where to build bridges over highways to decrease the risk of injury to mountain lions who need to cross these busy roads.


Enjoy these Learn ArcGIS lessons, and let us know any workflows you have for protecting endangered species by contacting us at  LearnArcGISSupport@esri.com


more
0 0 306
AdenaSchutzberg1
Esri Regular Contributor

New Learn Lessons
 
A Learn Lesson is a step-by-step tutorial that uses a real-world scenario to introduce key ArcGIS tools and workflows. Here's a roundup of new lessons in the Learn ArcGIS Gallery that have appeared in the last month.
 
Create a web scene to support construction planning (ArcGIS Pro, ArcGIS Online)
create_scene.png

In this lesson, as the GIS data manager for the city of Rotterdam, Netherlands, you will build a 3D scene representing the Rotterdam city center. First, you'll create an empty local scene in the Netherlands national coordinate system in ArcGIS Pro. Then, you'll add a basemap, elevation information, and features, such as buildings, bridges, trees, and street lamps. Finally, you'll publish the scene to ArcGIS Online. By the end of the lesson, the scene will be ready to use as a web-browser accessible backdrop to visualize any newly planned construction project.


Find ocean bathymetry data (ArcGIS Pro, ArcGIS Online)
find_ocean.png

In this lesson you are a student at the beginning stages of a research project studying the ocean floor off the East Coast of the United States. Before you can begin your analysis, you need to compile data. You'll visit a variety of online data portals to find different bathymetric datasets. You'll add this data to an ArcGIS Pro project both as services and as downloaded files.

When you're done you'll have an ArcGIS Pro project set up with useful datasets for the rest of your research. Along the way, you'll learn where and how to acquire bathymetry data, different data types used in oceanography, and how to add them to maps in ArcGIS Pro.

 
Get started with notebooks in ArcGIS Pro (ArcGIS Pro)
python_agpro.png

Python scripting can be used to automate workflows in ArcGIS Pro. Notebooks, included with ArcGIS Pro, are a good environment for writing Python code. In this lesson, you will write code to find areas with low access to fire department services. You will learn some of the basics of Python syntax. Code written in a notebook can be exported to a Python script, which be opened, modified, and run outside of ArcGIS Pro.


Visualize an ocean canyon in 2D and 3D (ArcGIS Pro)
visualize_canyon.pngBeing able to map, measure, and visualize bathymetric data is vital to managing resources in the ocean and coastal environment, where myriad activities occur with potential for conflict, including offshore energy (fossil fuels as well as harnessing sustainable wind, tide, and wave energy resources), seabed mining, national security, maritime transportation and fishing activities. In this lesson, you'll gain skills creating maps and making measurements of bathymetric terrain in both 2D and 3D. You'll also create and export a short animation of the canyon.


Build an interactive dashboard (ArcGIS Online, ArcGIS Dashboards)
build_dashboard.pngIn this lesson, you'll build an interactive dashboard that allows users to find charging stations for electric vehicles in Canada. As electric vehicles become more popular, knowing where charging stations are is important. Having sufficient access to stations can help make the decision to shift to an electric vehicle easier. It's also important to know that you can rely on access to stations when traveling. When it comes to finding charging stations, you don't need to see every location, only the ones that are relevant to your location and your vehicle. You'll configure the dashboard so users can filter the data to the province, city, and connector type that they need.


New Learn Paths

A Learn Path is sequenced set of resources for learning about a particular topic. Here's a roundup of some new paths in the Learn ArcGIS Gallery that have appeared in the last month. 

 
Try ArcGIS Image for ArcGIS Online (ArcGIS Online, ArcGIS Image for ArcGIS Online)
imagery_agol.pngUse ArcGIS Image for ArcGIS Online to host, analyze, and stream imagery and raster collections in the cloud.


more
2 0 876
Nerrissa
Esri Contributor

Happy World Aquatic Animal Day!


This Sunday, April 3rd, join us to celebrate World Aquatic Animal Day. Let’s spread awareness among the people around us on how critical aquatic animals are for society and ecosystems.

What are aquatic animals? Any animal that lives in water for most of or all its life is an aquatic animal—for example, fish, amphibians, reptiles, and coral. In recent years, the need to protect these valuable animals has generated important changes, including formulating new policies, planning outreach programs, and finding solutions for preserving aquatic animals.

Here is a list of Learn ArcGIS lessons that focus on aquatic animals. These lessons show you how to use GIS to assist in spatial planning efforts and aid in the overall preservation of aquatic animals:

Please enjoy these Learn ArcGIS lessons and let us know how you plan to celebrate World Aquatic Animal Day!

more
0 0 625
135 Subscribers