- Home
- :
- All Communities
- :
- Products
- :
- ArcGIS Survey123
- :
- ArcGIS Survey123 Questions
- :
- Re: Can you edit fields/results of survey123 featu...
- Subscribe to RSS Feed
- Mark Topic as New
- Mark Topic as Read
- Float this Topic for Current User
- Bookmark
- Subscribe
- Mute
- Printer Friendly Page
Can you edit fields/results of survey123 feature class in a dashboard?
- Mark as New
- Bookmark
- Subscribe
- Mute
- Subscribe to RSS Feed
- Permalink
I created a survey using survey123. Then I created a web map with the survey's feature layer. I put that web map into an operations dashboard and I want to show results from the survey. My survey has multiple fields that are just "text" types from the survey. I'd like to hide these fields so that they aren't showing in my dashboard. Is this possible? I also have some html used in my survey and the tags show up in the feature class results. For example, a choice for a selection in the survey is <b>Snowmobile Trail: Alternative 1</b>. and that is what shows up in the dashboard. Is there a way to change this in the dashboard so that the tags aren't showing up?
- Mark as New
- Bookmark
- Subscribe
- Mute
- Subscribe to RSS Feed
- Permalink
Hi Katie,
In terms of hiding fields, are you referring to hiding them in the pop-up within Operations Dashboard? Controlling field visibility should be managed by the web map that is being referenced by the Operations Dashboard app. So, you may want to play around with your pop ups in the web map, as listed here...Configure pop-ups—ArcGIS Online Help | Documentation.
As for the html tags of Survey123 choices showing up within Dashboard, I am not seeing the same on my end. Again, is this the pop-up? Please provide a screenshot if possible. Also Operations Dashboard for ArcGIS may be able to help.
Best,
Brandon
- Mark as New
- Bookmark
- Subscribe
- Mute
- Subscribe to RSS Feed
- Permalink
Hi Brandon,
In terms of hiding fields, I'm referring to fields in the 'Details' widget in my dashboard. My survey has a good amount of Note type fields:

And they show up in the Details widget:

Which takes up a lot of room and there's no useful information here, I'm more interested in seeing the questions that have responses. So I'm wondering if there is a way to not show these fields within this Details Widget: 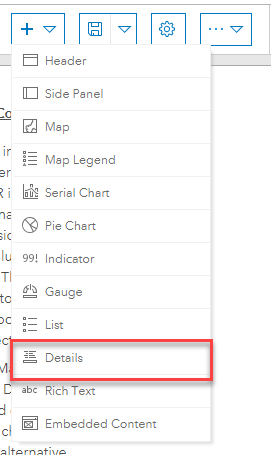
As for the html tags, they look like this in my survey:
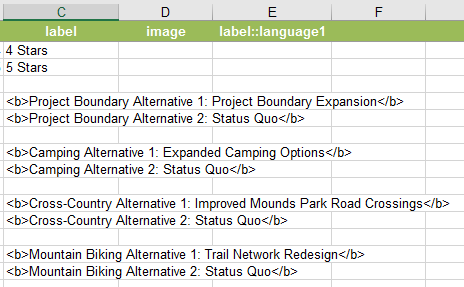
And show up like this in my Serial Charts:
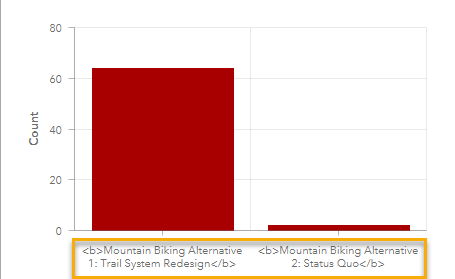
And I'm wondering if I can somehow have the tags not show.
I hope this clears things up a bit? Let me know if you have any ideas.
- Mark as New
- Bookmark
- Subscribe
- Mute
- Subscribe to RSS Feed
- Permalink
Katie Godding For controlling the display of fields in the Details widget of Ops Dashboard, you will want to control that in the pop up options of the web map that is being referenced by the dashboard. You can find out more about this information here...Configure pop-ups—ArcGIS Online Help | Documentation. Also, here is a screenshot
The fields selected here should then be the ones displayed in the Details widget.
As for the html displaying in the Serial widget, this may be a limitation of the html supported for this widget. I can let you know if I am able to find out more about this.
Best,
Brandon
- Mark as New
- Bookmark
- Subscribe
- Mute
- Subscribe to RSS Feed
- Permalink
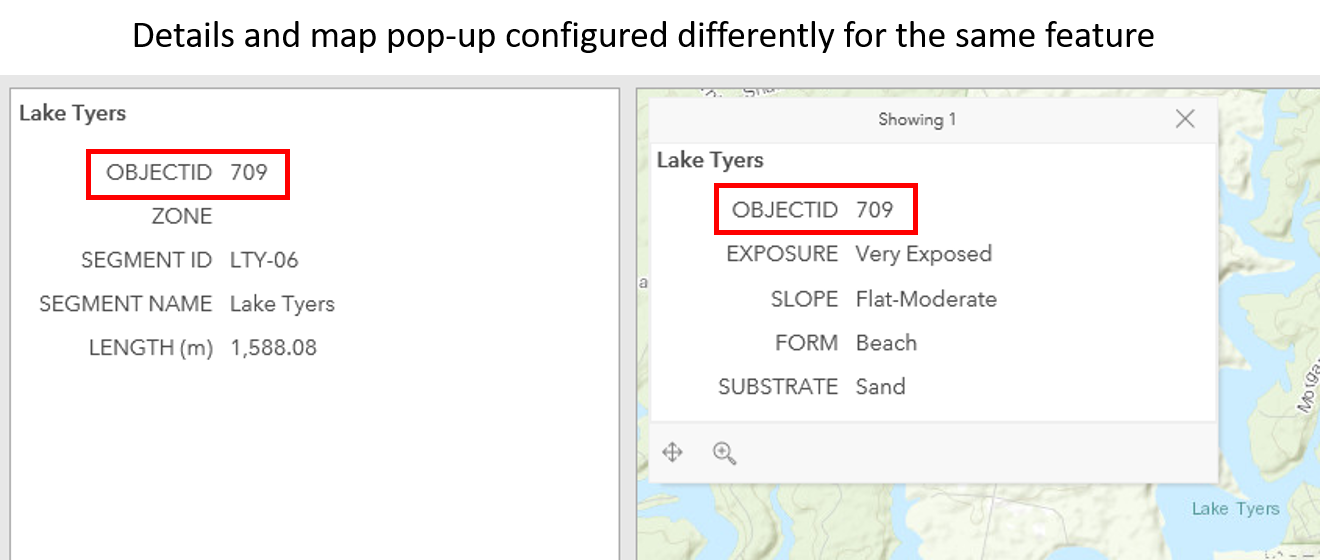
Katie Godding You can also Create a View Layer of the hosted feature and configure the pop-up for this differently if you don't want to change the pop-up in your map. Then point to this View for your Operations Dashboard Details. This way the pop-up in the map and the Details can be configured separately but still point to the same source. Just add the View to your map, configure the pop-up, and turn it off in the map. This way you can select it in the Details settings, but not have it pop-up in the map.
- Mark as New
- Bookmark
- Subscribe
- Mute
- Subscribe to RSS Feed
- Permalink
Hi Katie Godding,
The 'note' type doesn't usually get captured with the form. Could it be that it has an attribute 'name' field set? Notes don't need this - though you may get a validation warning (you can ignore it). You could remove the 'name' and delete the attribute in the feature layer.
For any field you don't want to write to the feature, in Survey123 Connect set the bind::esri:fieldType to null and it wont write that feature when the survey is submitted. In your feature layer, you can then delete that attribute completely. Hope that helps!
Jamie.
- Mark as New
- Bookmark
- Subscribe
- Mute
- Subscribe to RSS Feed
- Permalink
Hi all,
In regard to <b>Snowmobile Trail: Alternative 1</b> showing up in the serial chart, Your question is:
Is there a way to change this in the dashboard so that the tags aren't showing up?
I think there are two possible solutions:
1 - Remove the <b> tags and show the title as plain text (no formatting)
2 - Actually apply the <b> tags so the category labels are bold in the charts.
I don't think we would ever try to implement (2) because it's not a great idea to store label formatting within the layer's attribute table. Usually we try to separate the data in the table from how the data is displayed. If you want to make the labels bold.
To get our heads wrapped around (1)...the way serial chart displays field names is that we try to use the field alias whenever possible. If the field alias is not available, we default to the field name. I would first check your layer to see if these <b> tags are present in the field alias. Take a look at this layer I just created:
http://www.arcgis.com/home/item.html?id=5a29d8ae2d33400ca8e62f8051e712aa&view=table#data

If I pull this layer into dashboard, I see the tags in the chart just like in your dashboard:
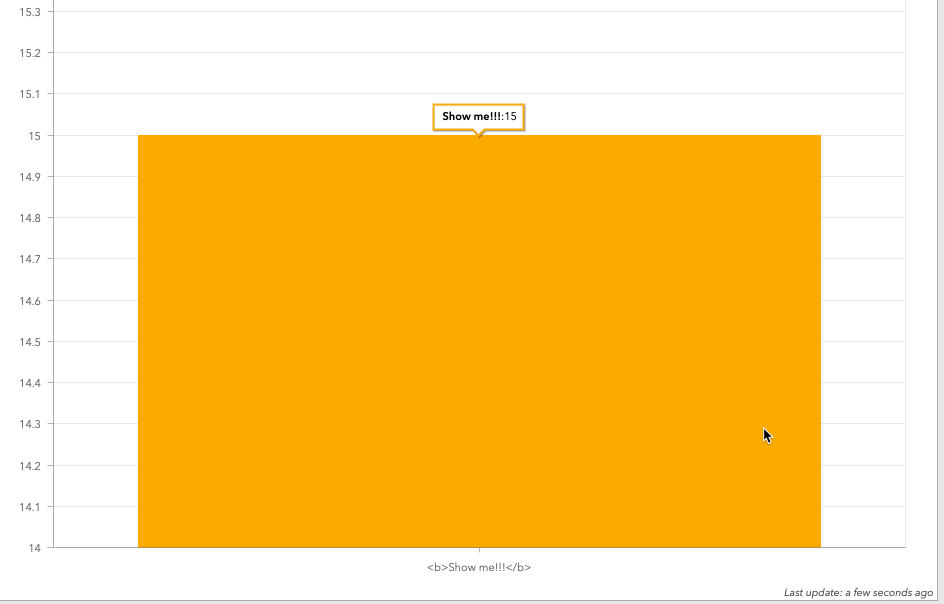
If you go into the fields and remove the <b> tags from the field alias (Also called Display Name), it will remove them from the serial chart.
If you actually want to make the labels look different on the serial chart, you can change the 'text color' option on the Dashboard Level Settings page which will propagate to the serial chart labels. I recommend this approach as opposed to trying to format things by putting html into field names/aliases.

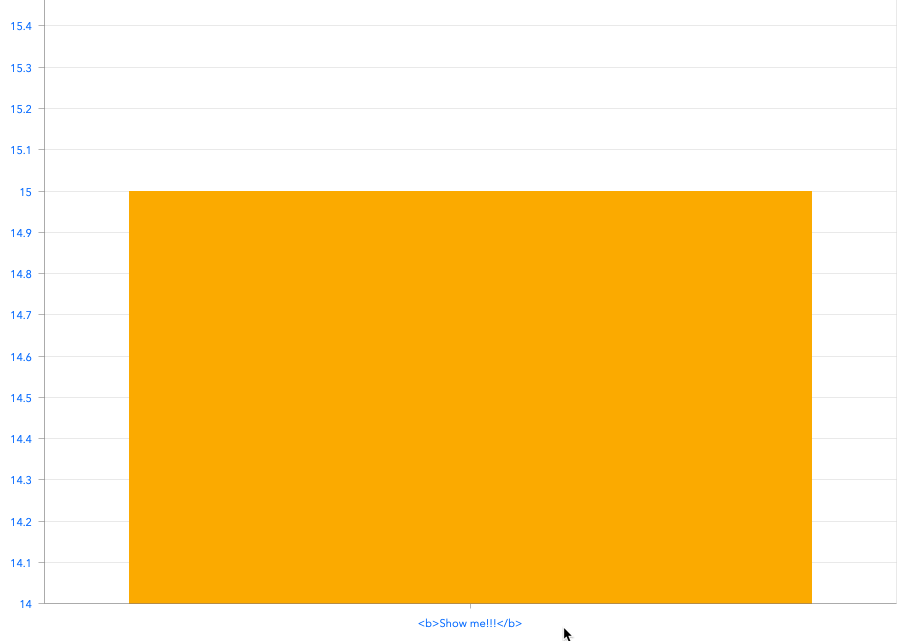
Hope that helps answer your question!