- Home
- :
- All Communities
- :
- Products
- :
- ArcGIS Survey123
- :
- ArcGIS Survey123 Blog
- :
- Using the image-map appearance in Survey123
Using the image-map appearance in Survey123
- Subscribe to RSS Feed
- Mark as New
- Mark as Read
- Bookmark
- Subscribe
- Printer Friendly Page
 Starting with Survey123 3.6, the field app now supports a new appearance of image-map. This new appearance allows Scalable Vector Graphics (SVG) files to be rendered in your survey form and provides a clickable image for both select_one and select_multiple questions. Choice list selections can now be made by simply selecting different parts of the image. The image-map appearance is currently not supported in the Survey123 web app.
So what is an SVG? An SVG file is an XML-based vector image format for two-dimensional graphics, that has support for interactivity and animation. SVGs also have the ability to have raster image formats such as .png and .jpg embedded within them.
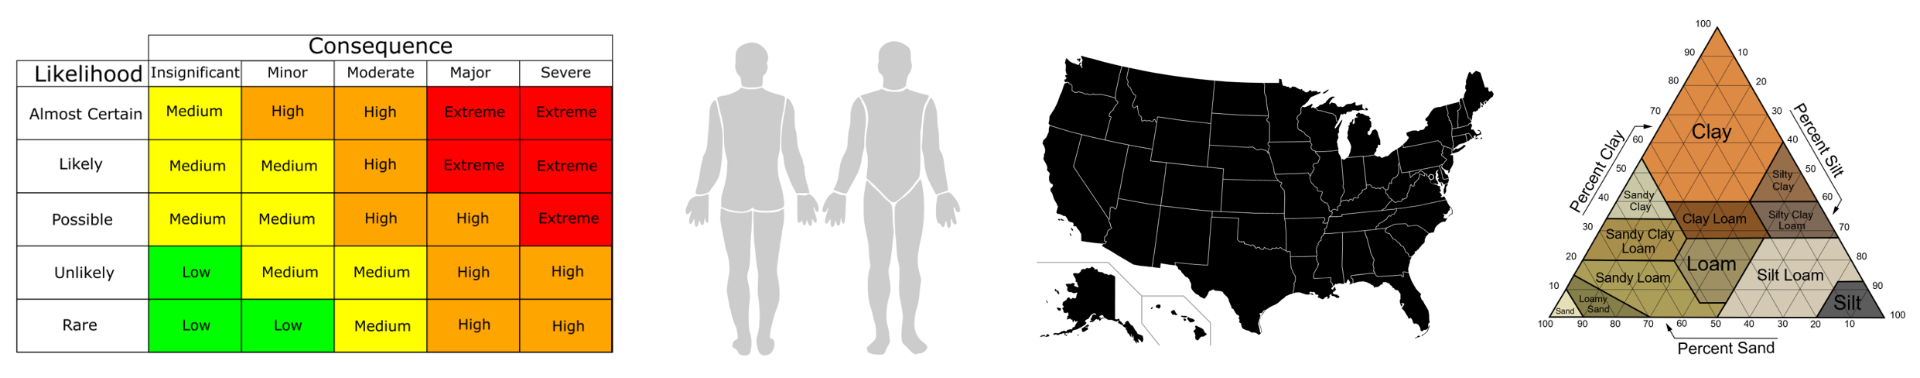
The image-map appearance provides a powerful way to customise the UI of your survey without having to write a single line of code. This enables fast and intuitive data collection with the underlying user selections stored in the feature service. The 'Image-map Sample' survey, available in Survey123 Connect, shows a variety of use cases including Risk Assessment, Body Parts, USA States and Soil Texture.
The animation on the right shows a Vehicle Damage Inspection survey that combines the image-map appearance with the photo watermark feature. This enables the inspection photos to be stamped with the corresponding vehicle part for easy identification later.
These examples involve relatively complex shapes and highlight what is possible, but the most simple of SVG files can also provide real improvements to survey usability. The ‘big button’ experience is easily set up with a basic SVG file. Also included in the 'Image-map Sample' survey is a ‘Level of Difficulty’ example that is essentially just an SVG file containing 4 clickable <path> elements (plus some text and symbols for ease of use).

Implementing the image-map appearance
The following steps relate to the 'Level of Difficulty' example in the 'Image-map Sample' survey. You can follow this process using the 'difficulty.svg' file attached to this blog.
1) Add a select_one or select_multiple question to your XLSForm (more information on this step).
2) Set up your survey choice list. Each entry needs a list_name, name and label. The values in the name column are the ones that link the choices to parts of your image.
| list_name | name | label |
|---|---|---|
| difficulty | beginner | Beginner |
| difficulty | intermediate | Intermediate |
| difficulty | advanced | Advanced |
| difficulty | expert | Expert |
3) Create an SVG file or assess an existing file for compatibility with Survey123. The second half of this blog goes into more detail on creating SVG images, for now just open 'difficulty.svg' (attached) in a text editor to assess it's compatibility.
- Ensure that your file has <path> elements with id values that match the name values in your choice list. The <path> elements with id values become the clickable areas of the image.
<path
d="M 5.4998702,5.4998718 H 129.50013 V 194.50013 H 5.4998702 Z"
id="beginner" />
<path
d="M 135.48042,5.4804192 H 259.51959 V 194.51958 H 135.48042 Z"
id="intermediate" />
<path
d="M 265.48041,5.4804192 H 389.51956 V 194.51958 H 265.48041 Z"
id="advanced" />
<path
d="M 395.48041,5.4804192 H 519.51959 V 194.51958 H 395.48041 Z"
id="expert" />- Non-clickable areas are <path> elements without id values and other element types eg <rect>, <circle>, <text> etc.
- See below for more detailed SVG requirements and tips for using with Survey123.
 4) Copy your SVG file into the media folder of your survey. The media folder is located in the survey folder (~\ArcGIS\My Survey Designs\{survey name}) which can be quickly accessed using the Files button in Survey123 Connect. If the media folder does not exist, you need to create it inside the {survey_name} folder.
5) Add image-map to the appearance column, and the name of your SVG file (include the .svg file extension) to the media::image column of your select question.
| type | name | label | appearance | media::image |
|---|---|---|---|---|
| select_one difficulty | difficulty | Level of Difficulty | image-map | difficulty.svg |
That's all there is to it!
Using SVG files in Survey123
While implementing the image-map appearance in Survey123 is simple, the contents of the SVG file itself can get confusing. SVG files can be created in a multitude of ways and each method may introduce issues when trying to use within Survey123. The remainder of this blog post will look at the most common ways of creating an SVG file and the associated tips and tricks for getting them to work in Survey123.
Minimum SVG requirements for Survey123:
- Must contain a <path> element that has an id value. Non-<path> elements such as <rect>, <ellipse>, <circle>, <image> and <text> will not be clickable. Likewise, <path> elements without an id value will not be clickable.
- No empty groups. Having empty groups ie <g> </g> within your SVG makes all <path> elements become un-clickable.
- Can only have 1 group per nest level. You can have as many nested levels as you like, but if you have more than one group at a particular level (including the parent level), all of the <path> elements become un-clickable.
- SVG height and width (Viewport) must be defined. While your image will likely display properly in Survey123 without these, your clickable areas may become offset from the underlying image.
- Viewbox must match Viewport (if specified). You don't need to specify a 'viewBox' parameter in your <svg> element. However, if you do specify a viewBox that differs from your height and width values, your clickable areas will be offset from the underlying image.
Other tips for SVG files:
- Transform functions. It is possible to have SVG elements with transform functions work perfectly in Survey123. However, we must understand that transforms have a cumulative effect when applied to nested elements. It is often best to avoid transform functions if possible.
- Number of clickable areas. Although most web browsers can render SVG files with up to 5,000 elements without any issues, these are obviously not practical for use in Survey123. Be mindful that each clickable <path> element needs to be large enough on the screen for the user to select. You'll need to consider what platforms, devices and screen sizes you're using Survey123 on, to decide on a practical limit that suits you.
Downloading the perfect SVG from the web!
So you’ve found the perfect SVG online and have downloaded it for use with Survey123. While the image you found online may look perfect, it needs to include the required <path> elements to be clickable in Survey123.
There are numerous desktop vector graphics programs like Adobe Illustrator, Corel Draw and Inkscape as well as online SVG editors like Vectr, BoxySVG and DrawSVG. Most of these have tools that will convert different types of objects (eg <rect> or <circle>) to <path>, so perhaps your downloaded image can be easily tweaked to suit Survey123.
There are online resources that have SVG files for download that are designed in a way that suits Survey123, particularly those with geography content like www.simplemaps.com and www.amcharts.com. Most SVGs you'll find online have not been designed in this way so open your file in a text editor to quickly assess the contents.
Converting an existing raster image into an SVG
You may have the perfect .png or .jpg raster image that you would like to use with the image-map appearance in Survey123. The image-map appearance only supports SVG files, so you will need to convert your raster to SVG first. Vector graphics programs have tools that basically trace your raster and create SVG objects which can be very effective. Alternatively, online converters such as www.pngtosvg.com or www.image.online-convert.com/convert-to-svg can help you achieve this. Results can vary, but some experimentation with the settings and thresholds can yield usable SVGs in no time.
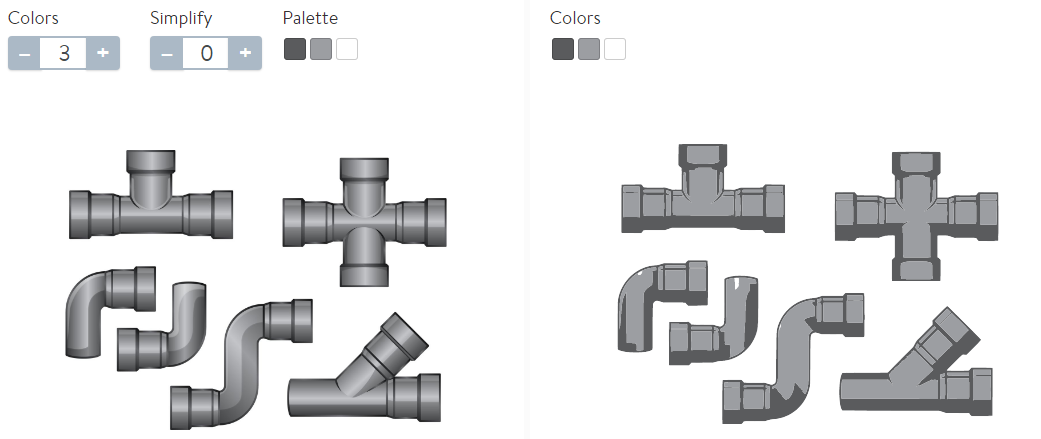
It is best if your raster image contains filled shapes with a limited range of colours. The 'Pipe Fittings' example was created using www.pngtosvg.com to first convert a .jpg to SVG. Then the unwanted light grey <path> elements were deleted using a text editor:

Creating an SVG from scratch
 This option gives you the greatest control over your SVG file. While it is possible to write an SVG entirely in a text editor, vector graphics programs like the ones listed above are the easiest way to create an SVG from scratch. If you're completely new to digital graphics then perhaps the online SVG editors are your best bet. Otherwise, desktop programs often have a larger toolset without limitations on importing and exporting your finished SVG. Inkscape is a free and open source vector graphics editor and was used for some of the SVGs in the sample survey.
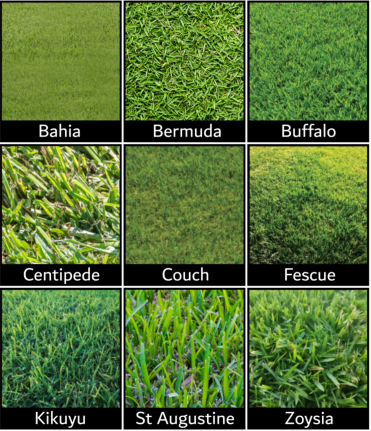
The main advantage of using a vector graphics program is that you can easily embed raster images too. Embedding a photo into your SVG can be very useful, for example when the user needs to identify the selection they're making. Here is an example that includes photos of different lawn varieties:
TIP: Having a raster image in the background of your SVG and drawing some simple shapes over areas you would like the user to click is often the quickest and easiest way to create your SVG for use with Survey123. The 'Stranded Oil Distribution' example was created using a .png file as the background image. Then 24 x squares were drawn as <path> elements over the top of the background image. They were given no stroke or fill properties so they are invisible, but they define the clickable areas that correspond to the underlying parts of the background image.
More Information
The image-map appearance type is included in the Survey123 documentation here: Select one and Select multiple.
Detailed information on the SVG specification can be found here: Scalable Vector Graphics (SVG) 1.1 (Second Edition) and Scalable Vector Graphics (SVG) 2.
You must be a registered user to add a comment. If you've already registered, sign in. Otherwise, register and sign in.