Survey123 Tricks of the Trade: Summary sections in reports

16317
23
08-26-2020 09:49 AM
IsmaelChivite
Esri Notable Contributor
4 23 16.3K

The original release of the Survey123 report capabilities centered around the notion of producing reports for individual records.  With each Survey123 update, we progressively expand the report template syntax to help you build better reports. In this blog, I want to explore in detail summary sections, which were added in our July 2020 update. The content of the blog is not for beginners. I assume that you are already familiar with creating your own report templates. If not, I suggest you learn the basics from the following resources:

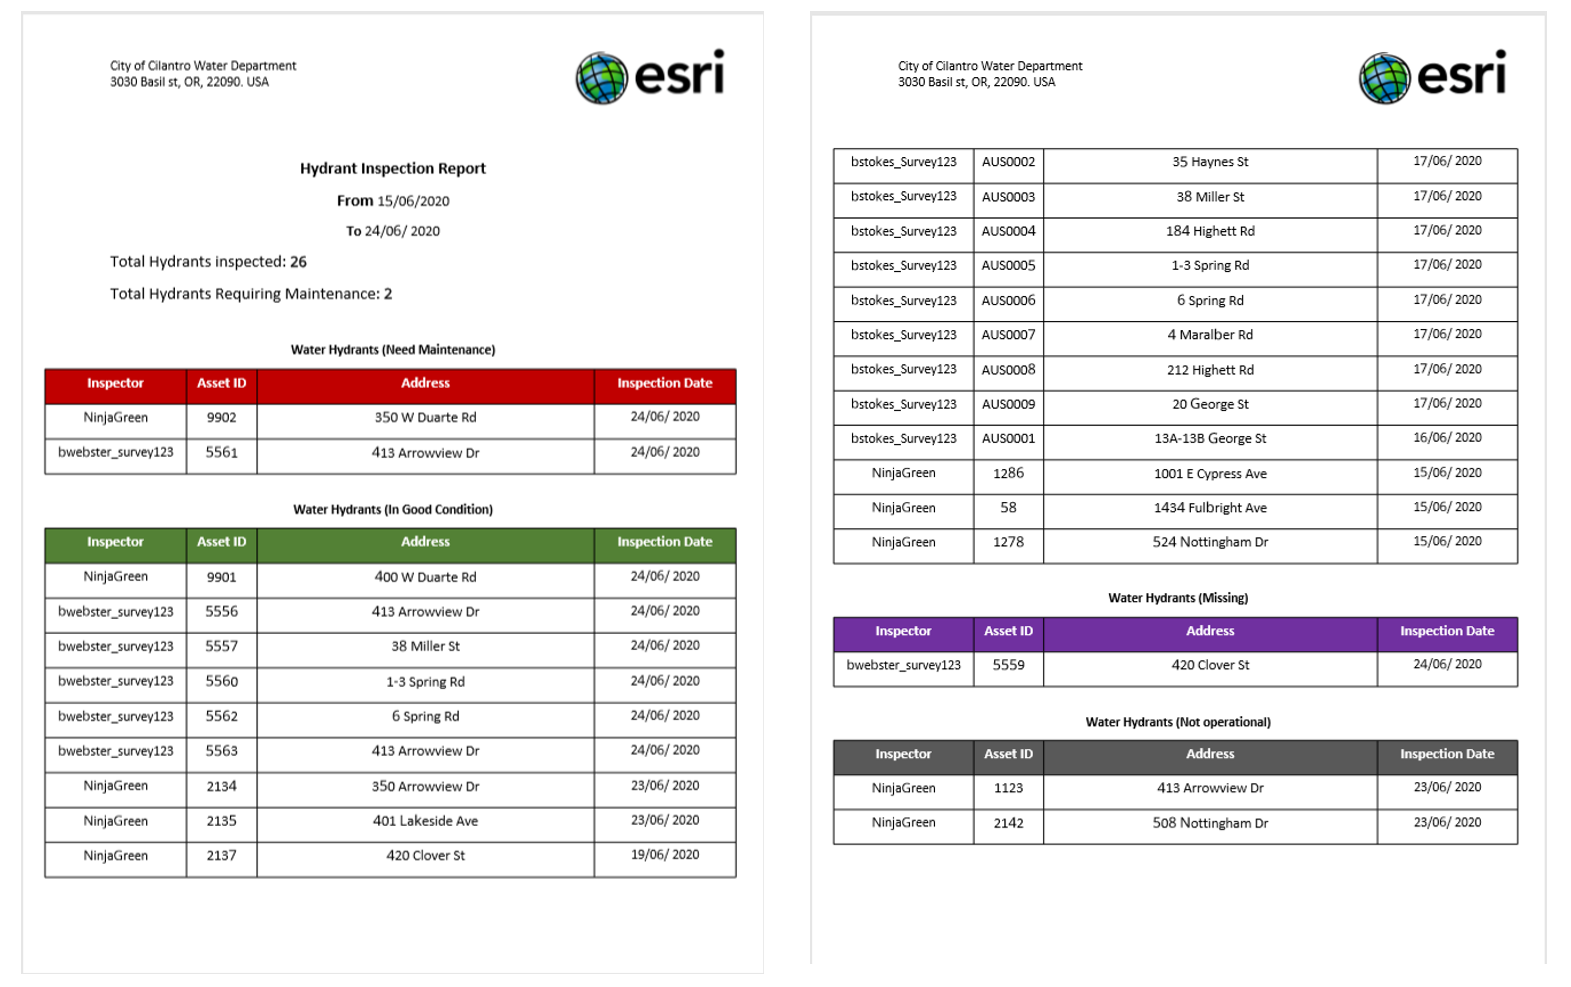
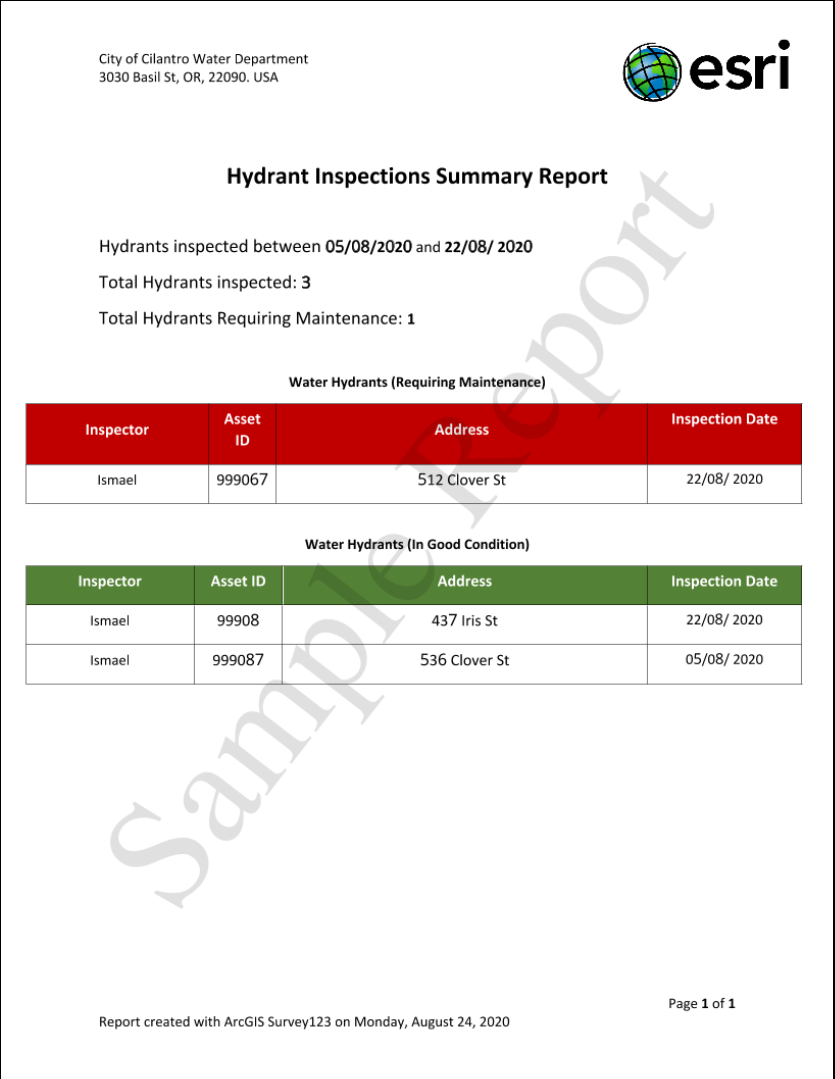
Summary sections are generally used to create a single report for a collection of survey records. This would commonly be referred to as a 'summary report'.  Below is an example of a Hydrant Inspection Report that illustrates this concept. Note that tables are used to categorize and report all the hydrants that have been inspected within a certain period. You can click on the image to enlarge it.

Water Hydrant Summary Table

Other examples where you may want to use reports like this include include:

  • Code violations by district report
  • Monthly hydrant inspections report
  • Property damage assessments by severity report
  • County household survey summary

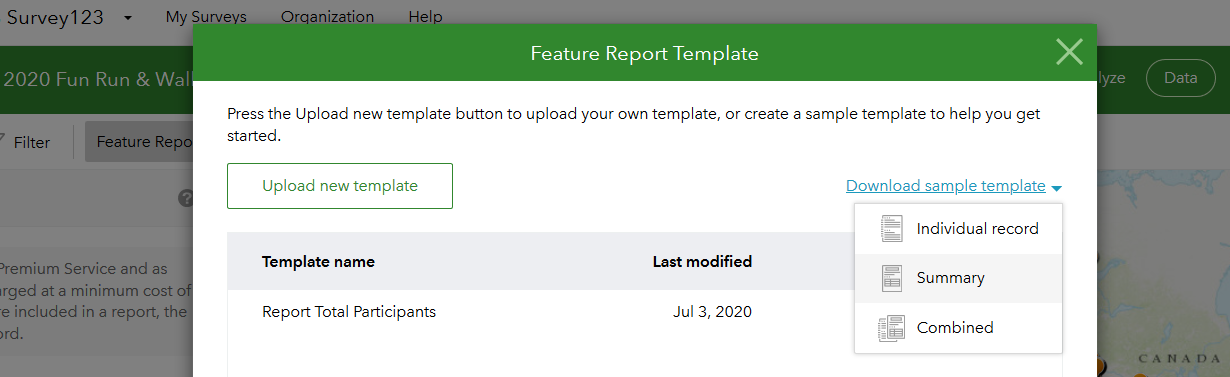
A great way to get started with summary reports is to generate a Summary sample template on the Survey123 website.
The sample template demonstrates some useful summary syntax. You can then combine what you learn from the template with the Survey123 documentation to adapt the sample into your own report template.

In this blog, I will show you how to build a template completely from scratch. I want to do it that way, because I want to describe some aspects of the report template design process that will not be apparent when using the sample template.

The best way to follow this blog is hands-on. Set aside 90 minutes or so and let's build the hydrant report together.

Setting up the hydrant inspection survey sample

Before you can create a report template you need a survey with some data. We will use the Hydrant Inspections sample template that comes with Survey123 Connect:

  • Open Survey123 Connect and sign in using an account with publishing permissions.
  • Click on New Survey, and look for the Hydrant Inspection form in the Community group.

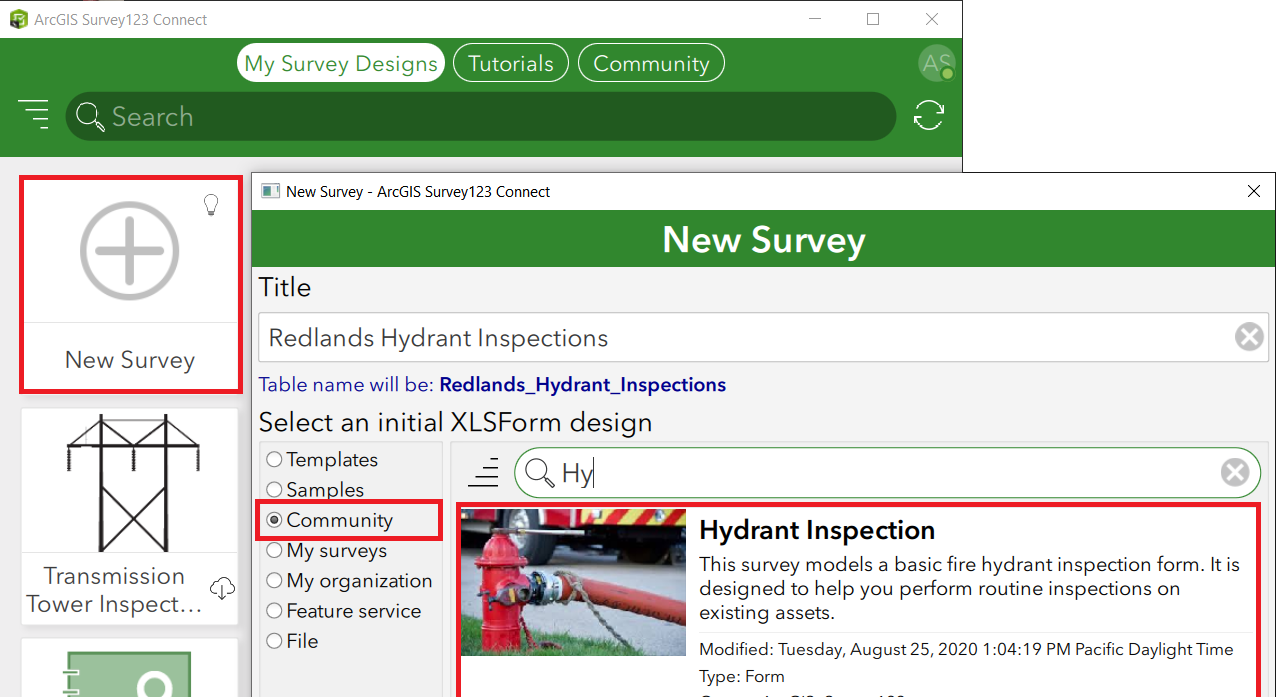
  • Make sure you set your own title for the form. In my case, I will call it Redlands Hydrant Inspections.
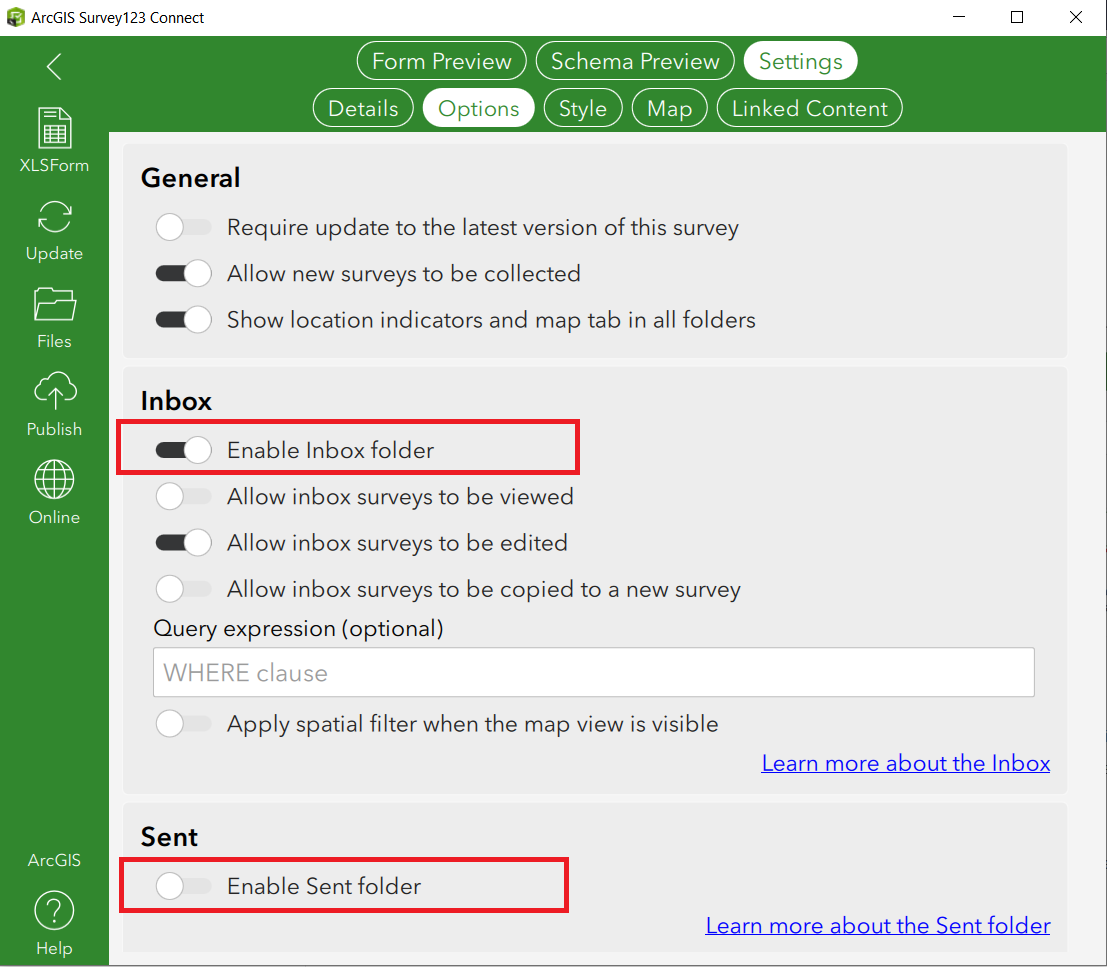
  • Before you publish your survey, go to the survey's Options dialog and enable the Inbox and disable the Sent folder.

  • Publish your survey and add three or four of records using the Survey123 field app.

Now that we have a survey and some data in it, let's proceed with the creation of our report template.

Getting started with the report template

We are going to progressively build up our hydrant report template. To get started, we will add a header, footer, title and a table to display a survey record selection. Below is a screenshot of our initial goal. From this humble beginning, we will add more and more contents one step at a time.

Headers and Footers

Adding a custom header and a footer to your template is generally a good practice. A descriptive header and footer make your report more presentable and provide useful information. Headers and footers cannot include Survey123 report placeholders, but you can insert Microsoft Word autotext elements and static information that will be displayed across all pages in your output report.  In my case I added an Esri logo and a fictitious address in the header. In the footer, I inserted autotext to automatically display the date when the report is created and also the page number.

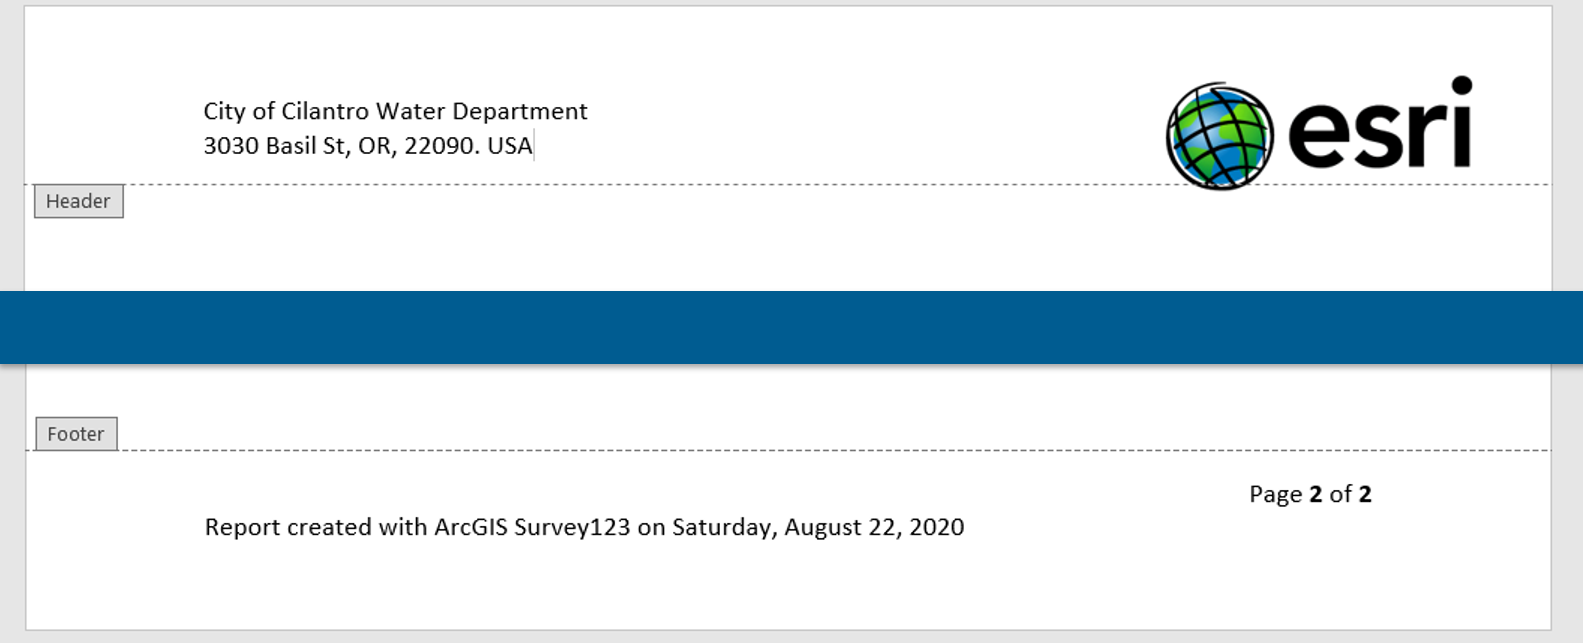
You can add other Microsoft Word design elements, such as page borders, watermarks and backgrounds. Make sure you use these features wisely as they can help give your reports a professional touch.

Title and Table (Basic setup)

Next, we will add a title and a table into our report, as shown below. The table will display a handful of attributes from the survey records. For now, simply add a title and a table as shown below.

Understanding summary sections

Our template is still incomplete, but let's upload it to see how it works.

  • Sign in into survey123.arcgis.com.
  • Open the Data tab for your hydrant inspection survey. You should see the records you added earlier.
  • Open the Feature Report panel and click on the Manage templates link.

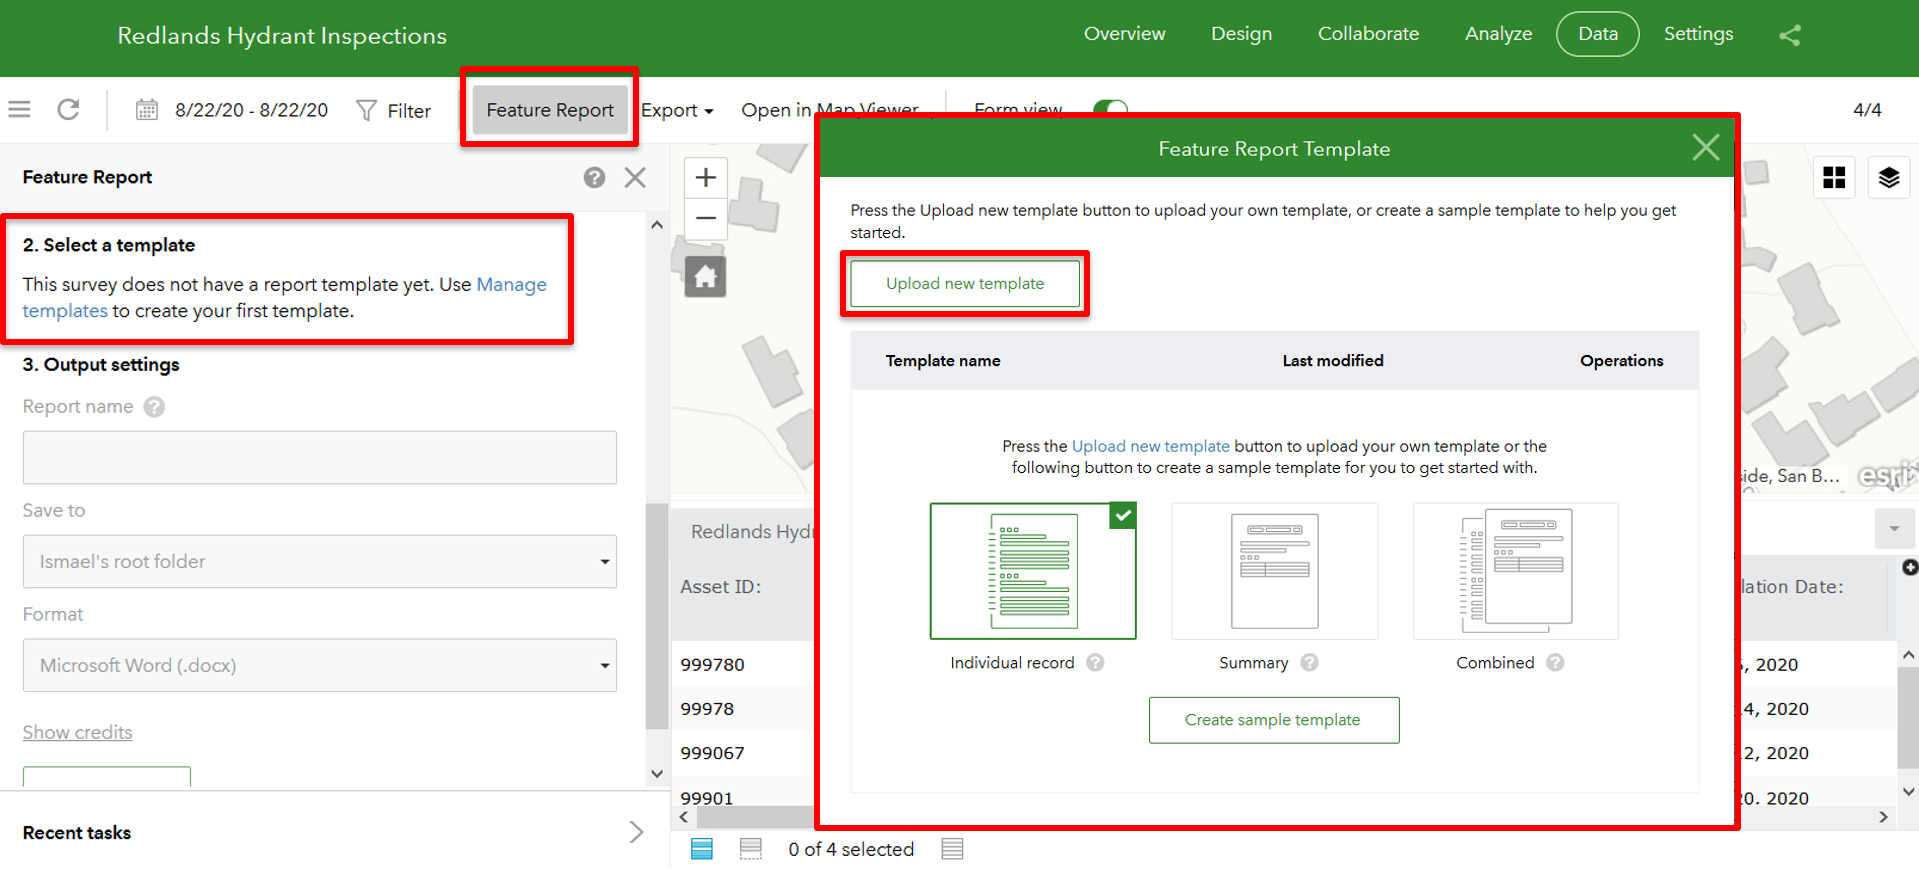
  • Click on Upload new template.
  • Browse for your report template and upload it.
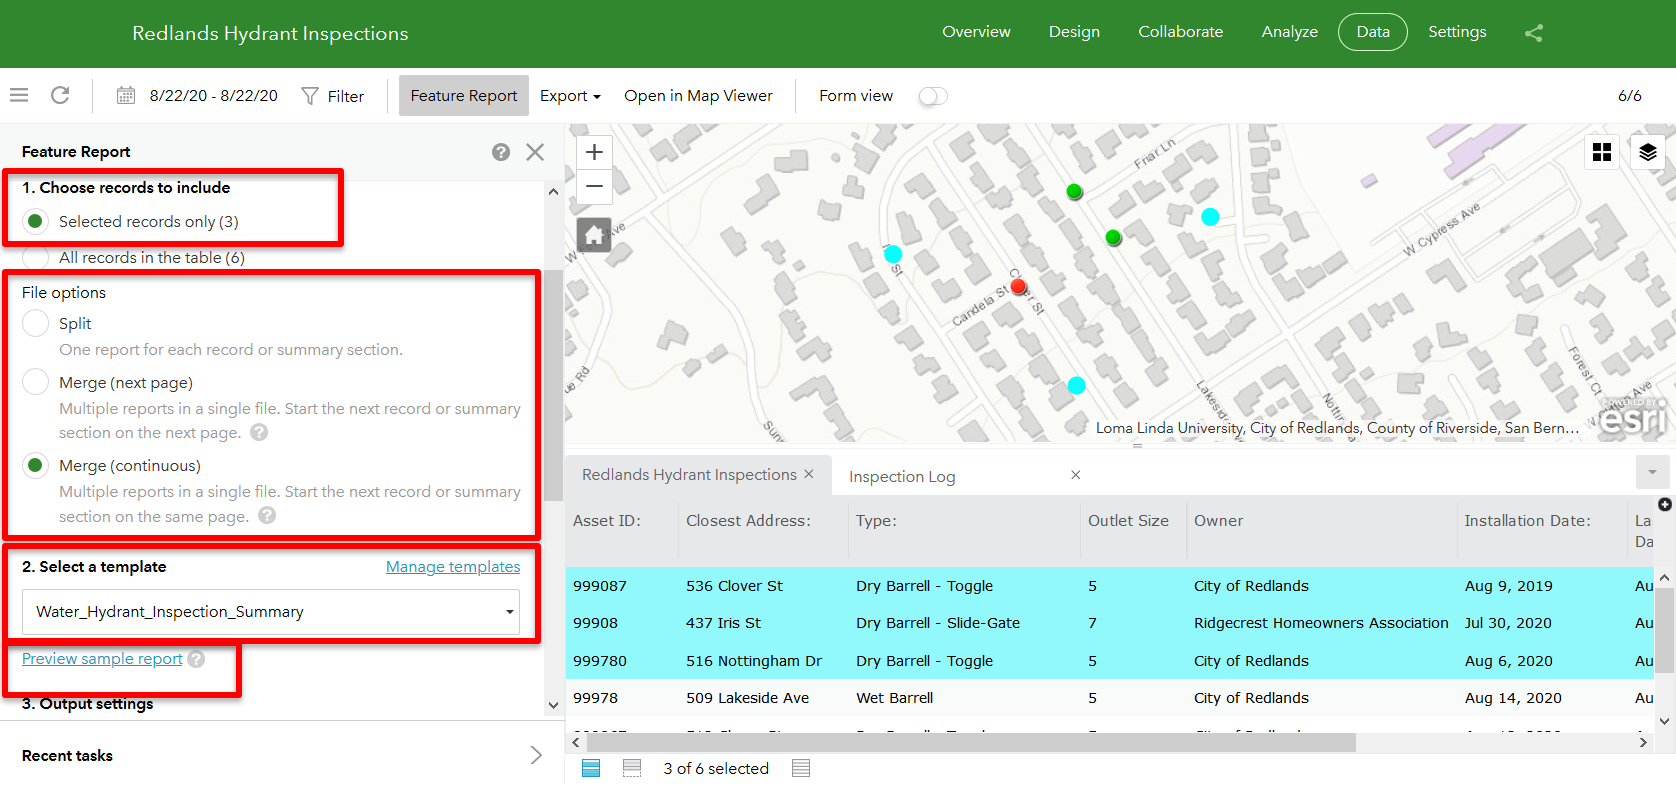
  • Next, select three of the hydrant records you created and generate a preview sample report:
    • Select 3 records in the table
    • In the side report panel, make sure the report is executed against the selected records only.
    • In File options, select the option to merge into a single continuous document
    • Select your template
    • Click on the Preview sample report link

Your sample preview should look like this:

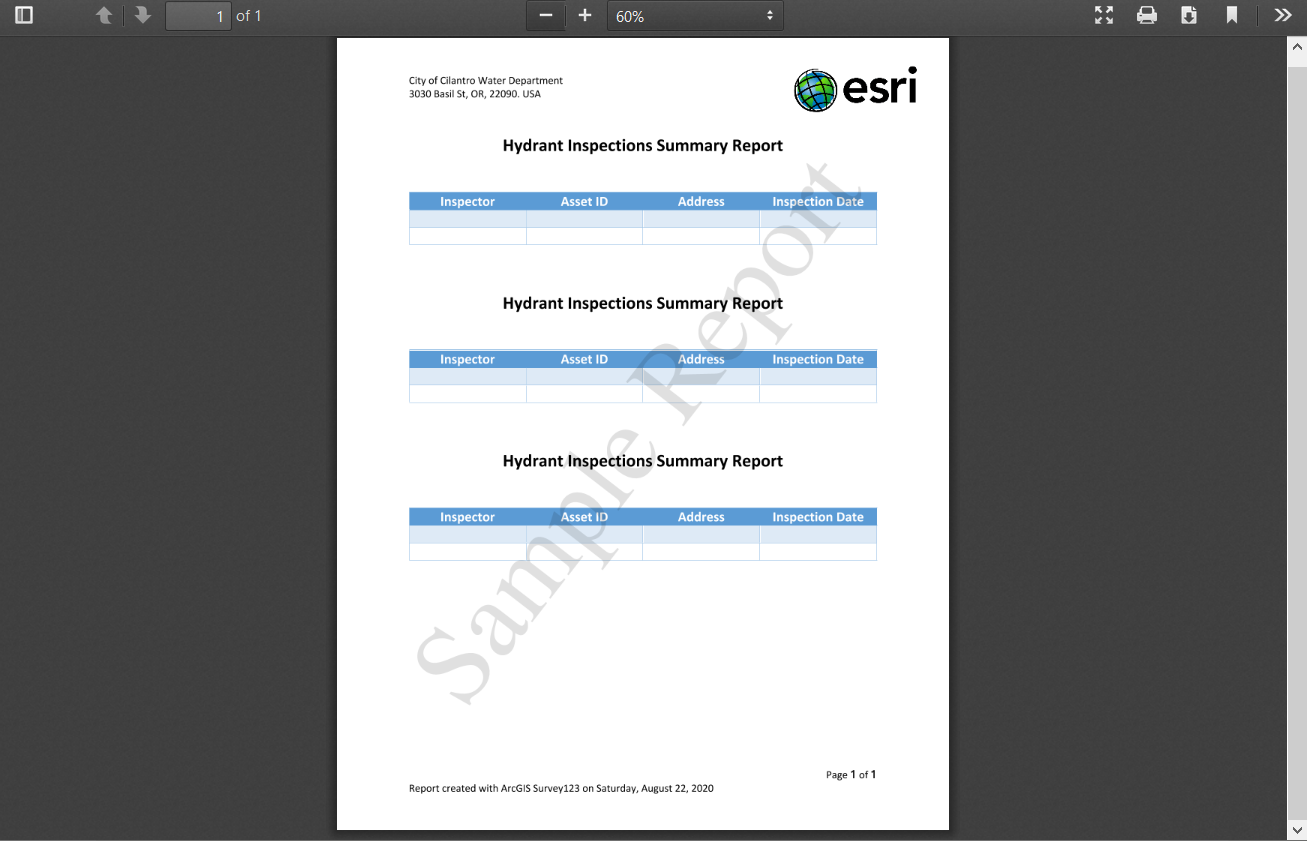
I bet the output is far from what you expected:

  • Why the table is empty? The table shows no records because we did not add instructions in the report template to fetch data from your survey. We just added a title and an empty table in it.
  • Why are the table and title repeated three times? The table is repeated because when you ask Survey123 to create a report for a selection of records, your report template is processed once for every record in your selection. Unless you enclose your template contents within a Survey123 summary section, this output is expected.

OK. So now let's add a summary section. A summary section is opened with $<$summary> and closed with $</>. Edit your template as shown below. Note that I highlighted the summary section tags in green. The formatting of the tags does not make any difference to the Survey123 report engine, but it can make your template more readable.

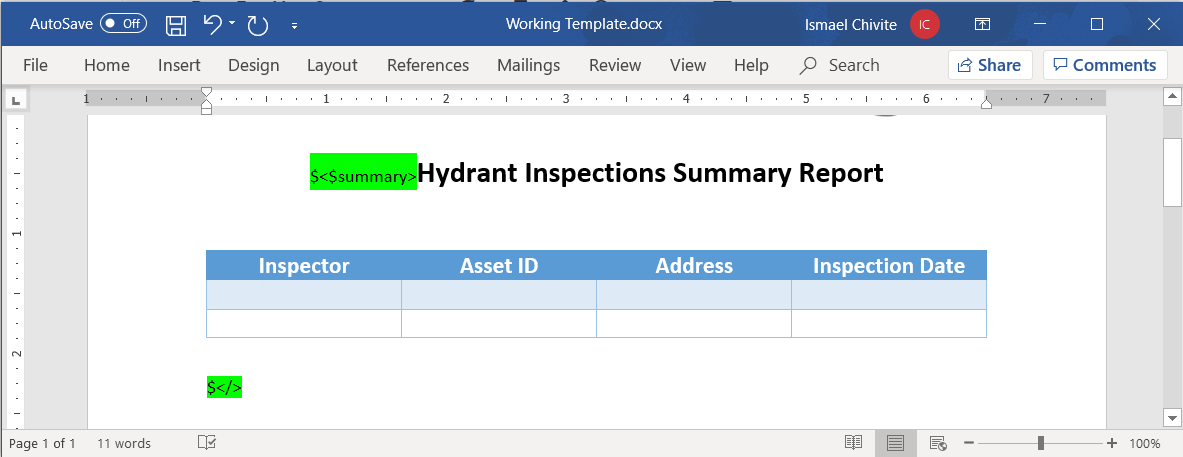
Note that the title is inside the summary section. As we just learned, contents outside of the summary section will be processed once for each selected record. We do not want multiple titles in our case, or multiple tables, so of these elements need to be placed inside the summary section. 

Finally, note that I added the $<$summary> opening tag in the same line as my title.  I did this on purpose, because I do not want to introduce an extra line in my output report. When the $<$summary> tag is on its own line, the line it occupies will not be removed in the output report. Sometimes you want to have $<$summary> in its own line, and sometimes you don't. It depends on what you want to do.

As we make changes in the report template, it is important to regularly upload it to the Survey123 website so we can check the syntax. Otherwise it can be challenging to figure out where exactly syntax errors happen.

  • From the report panel on the right side, click the Manage templates link.
  • Use the Edit icon in your template to upload your new version.

  • With your 3 records selected, click on Preview sample report.

At this moment, since you have no contents in your report template outside the summary section, the output of your report request is a single report, in a single file, with a single title and table.

Populating our table

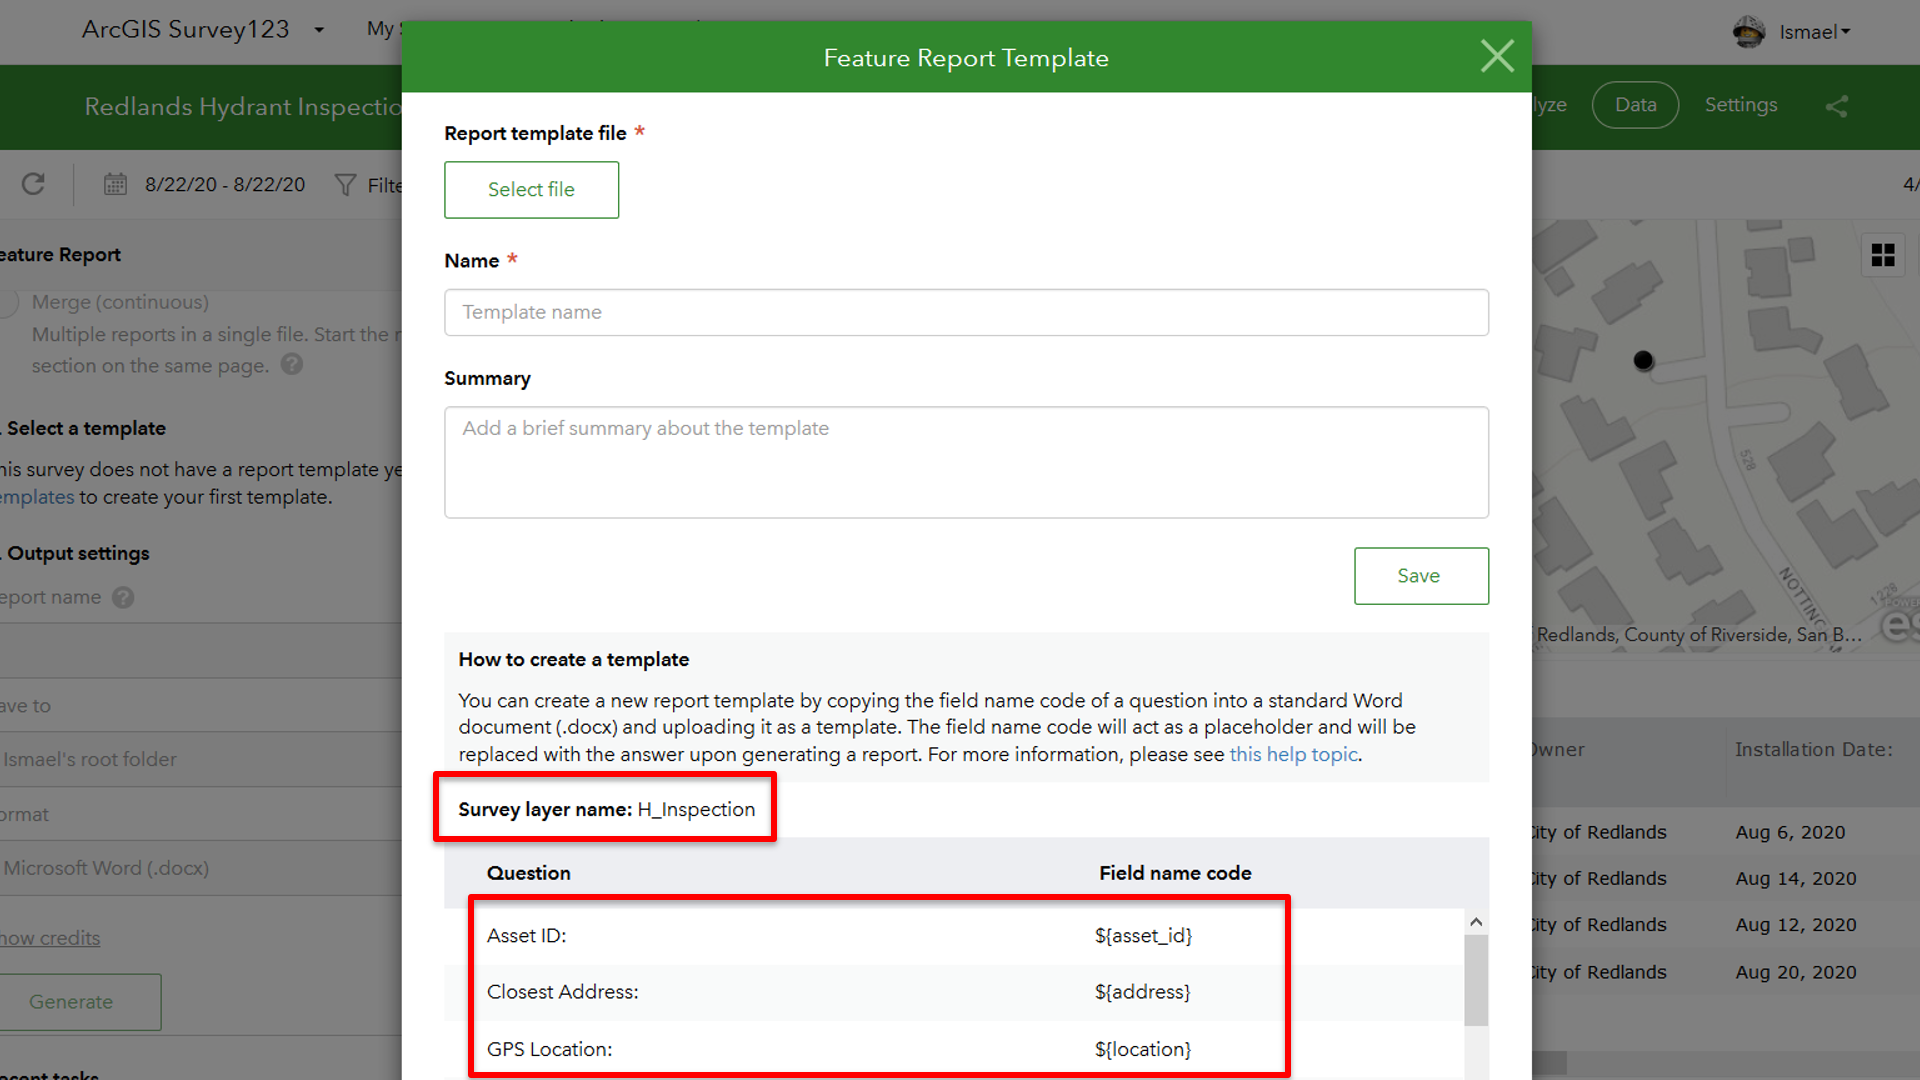
We need to add instructions within our table to fetch information from the selected set of records. To do this, we need to reference in our template the layer and fields from which we want to retrieve the data. Since we may not remember the exact name of layers and fields, we will use the reference table from the Upload new template dialog.

  • From the report panel on the right side, click the Manage templates link.
  • Use the Edit icon in your template.
  • The Upload new template dialog shows the reference table at the bottom, as shown in the screenshot below.

We will use this reference table regularly, so keep this dialog open.

First, we will create what is known as repeat section. When a repeat section is encountered by the Survey123 report engine, all contents within the section are processed for every record referenced in the repeat. A repeat section is opened with ${#LayerName} and is closed with ${/}. As you can see in the screenshot below, the layer name needs to be replaced accordingly. You can get the layer name for your survey from the reference table in the Upload new template dialog.  In the context of Survey123 report template syntax, the # sign in the opening tag is an indication that the section is a repeat.

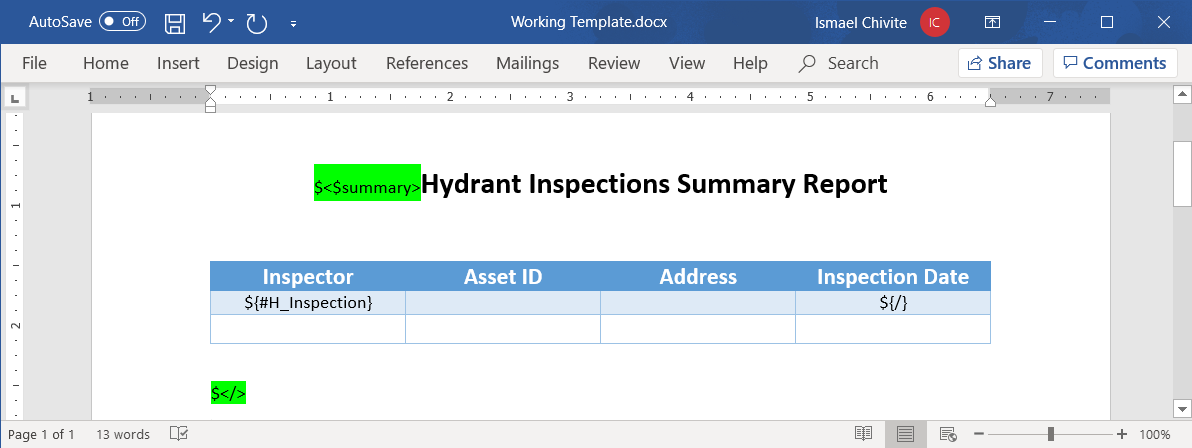
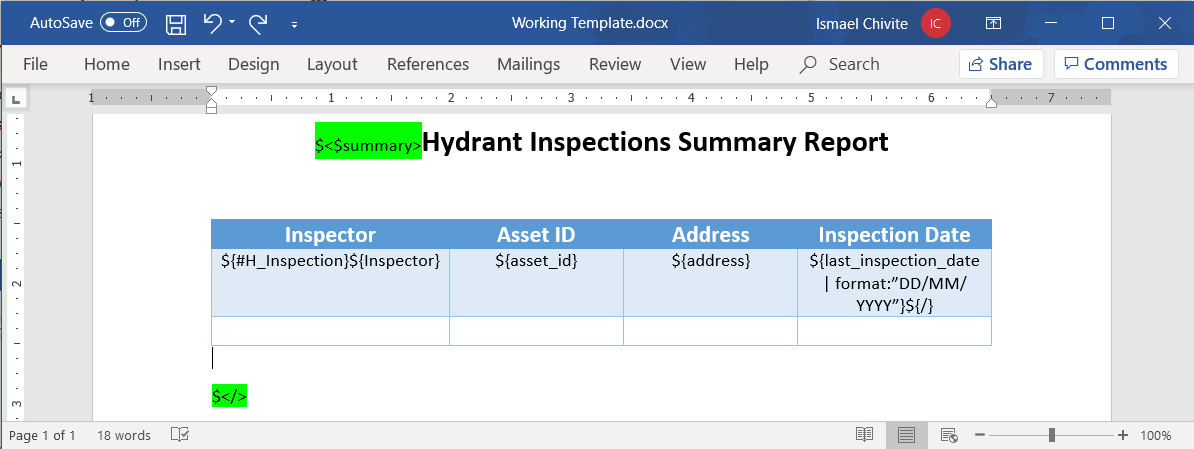
If you were to upload and run a report with the template above, new rows will be added to the table: one row per survey record. To complete the table, we need to make sure we have instructions to pull values from the corresponding fields.  The table for our survey will look like this:

It is important to note that out of all the Survey123 report template syntax we have added in our table, some parts will not be included at all in the output, and others will be replaced with data. 

  • The repeat section opening and closing tags will not be included at all. This means that you can use whatever formatting you want in your design to make it more legible.
  • The syntax to retrieve data from fields will be replaced with values from the records, so the formatting you apply to your report syntax matters. For example, if you insert an instruction like ${asset_id} setting the font color to blue, then the Asset ID will be rendered blue in the output report.

To be more exact, to define the formatting of your field values in the output report, you do not need to change the format for the entire Survey123 report template syntax. The only character that matters is the initial $ sign. This is important because sometimes the syntax can be long and interfere with your design. A good example is the Inspection Date in our sample. It uses three lines in the cell, affecting the height of the whole table in the design view.  To avoid this, use a smaller font size for the expression and apply the font style you want for the Inspection Date to the $ sign only. Here is an example of a sample preview report with various formatting styles applied:

At the end of the table, you can see an empty white row. If you do not like that, go into you report template design and remove it from the table.

So far, we have explored how to insert a table into our report to display all the input records as rows.  This is a basic, yet powerful technique that will help you model many reports you may be asked to build. Next, we will cover how to include multiple tables in a report and control the contents of these tables using filters.

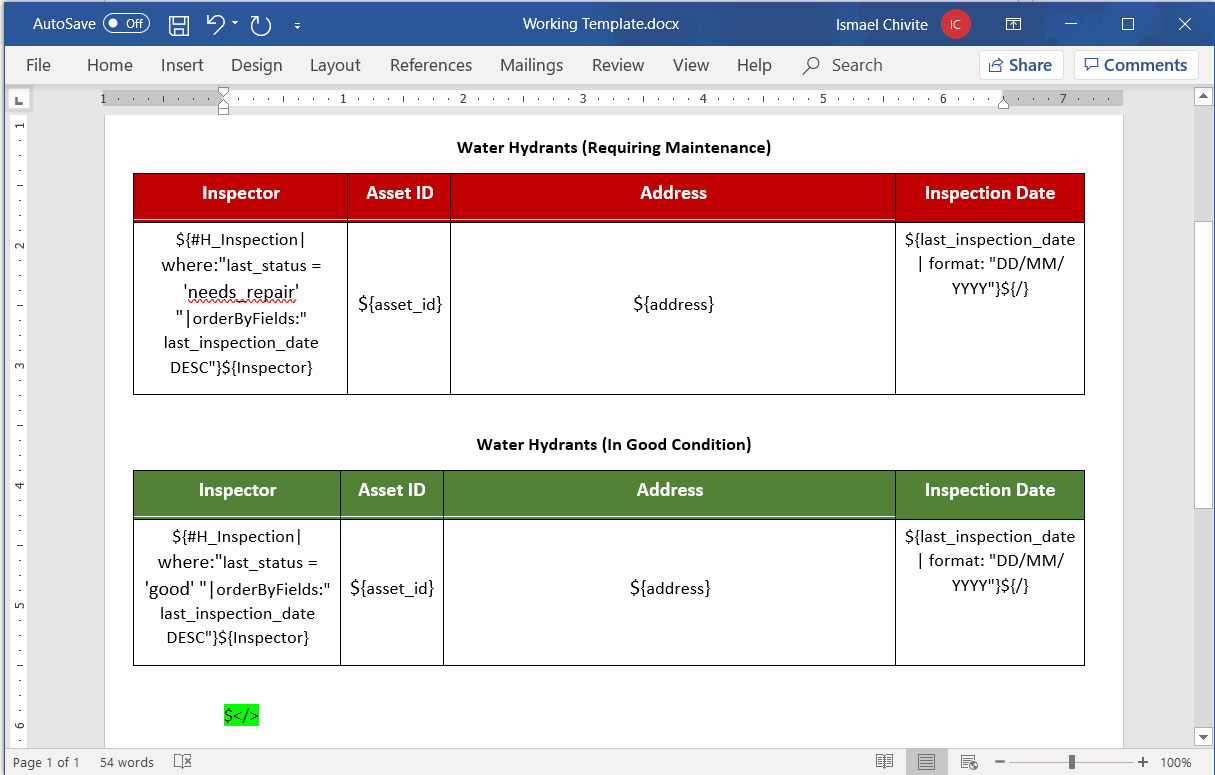
Filtering and sorting report records

When defining your repeat section against the survey layer, you can use parameters to filter and sort records in your selection. For example:

${#H_Inspection | where: "last_status = 'needs_repair' " | orderByFields:"last_inspection_date DESC"}${/}

The where parameter filters the input selection from the report request. The orderByFields parameter is used to present rows sorted by inspection date in descending order.  Using filters in this way, you can insert into your report multiple tables, each for the different conditions found in your data.

Filters in your report template apply to only the collection of records selected for the report. For example, if you use the Survey123 website to select 100 records out of 2000 and then request a your summary report, the filters within the template only apply to the 100 selected records.

Statistics

A summary report might also include statistics. For example, in our hydrants example we may want to present a total count of all hydrants inspected, or a table showing a count per status. The following expression returns the total count of records from the Redlands_Hydrants layer that have been submitted to the report.

${Redlands_Hydrants |  stats:"count,objectid"}

This expression returns the total number of hydrants that need repair.

${Redlands_Hydrants | where:"last_status = 'needs_repair' " | stats:"count,objectid"}

To get the statistic, you need to pass the statistic you want (sum, max, min, count, avg) and also the field on which you want to calculate the statistic. Records with null values will be ignored.

Back to our template, we could do something like this:

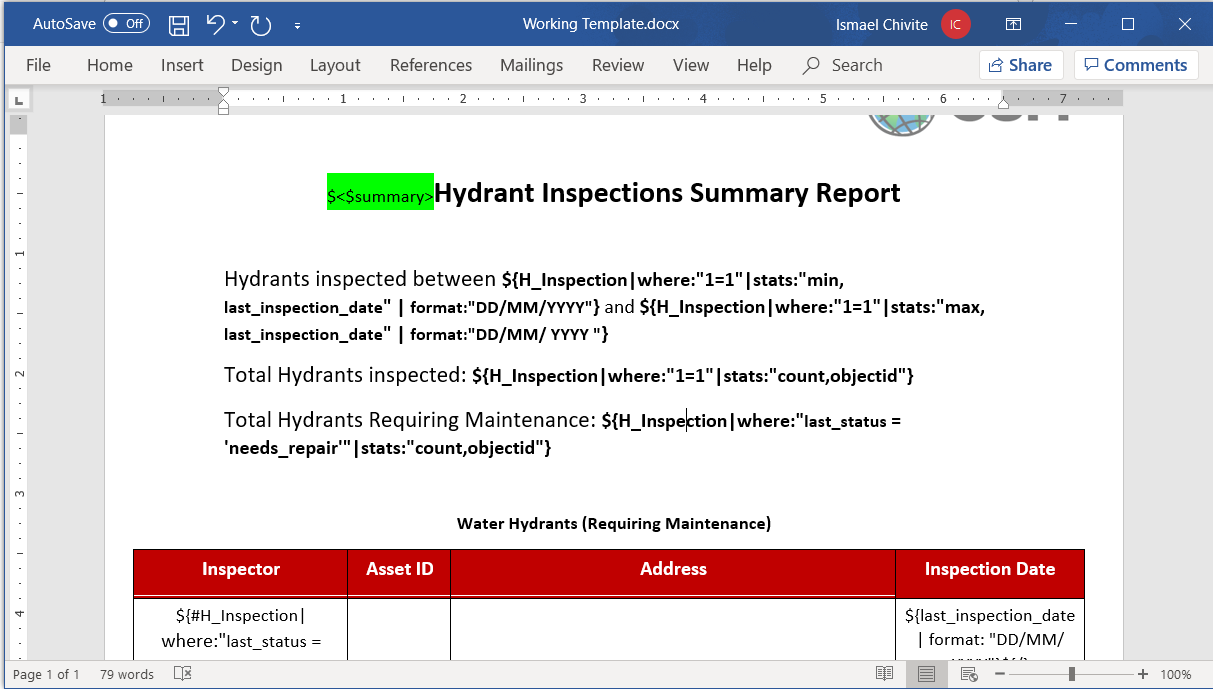
And here is what I get in the final report with a selection of 3 records. The report is now looking a lot more like the summary we set out to create!

!important

The expressions we have used so far to process records within the survey layer, or to extract statistics out of it, are limited in scope to the survey records selected for the report.  By using the !important parameter, you can make the report engine work against all records in the layer you are referencing. 

For example:

Retrieve the count of all hydrants in the Redlands_Hydrants layer that need repair:

${Redlands_Hydrants | where:"last_status = 'needs_repair' !important " | stats:"count,objectid"}

Retrieve the count of all the selected hydrants in the Redlands_Hydrants layer that need repair:

${Redlands_Hydrants | where:"last_status = 'needs_repair' " | stats:"count,objectid"}

Create a repeat block to process all hydrants in the Redlands_Hydrants layer that need repair:

${#Redlands_Hydrants| where:"last_status = 'needs_repair' !important "} ${/}

Limit the repeat block to selected hydrants that need repair:

${#Redlands_Hydrants | where:"last_status = 'needs_repair' "} ${/}

The !important modifier must be used in the context of a where statement. For example, if you want to get the total number of records in a layer, you cannot do this:

${Redlands_Hydrants | !important | stats:"count,objectid"}

You have to do this:

${Redlands_Hydrants | where:"1=1 !important " | stats:"count,objectid"}

Additionally, this is incorrect, because the !important parameter is left out of the where statement.

${Redlands_Hydrants | where:"1=1" !important | stats:"count,objectid"}

This is correct, because !important is enclosed by the closing quote of the where statement

${Redlands_Hydrants | where:"1=1 !important " | stats:"count,objectid"}

An important (no pun intended) note when using !important in a repeat section is that the number of records retrieved will be limited by the maxRecordCount property in your target feature layer. Say, for example, you have 3,000 hydrants and you use !important to create a table with all 3,000 records. You will find that only the first 1,000 will be shown in the table, because the default maxRecordCount is generally set to 1,000.  If you want to alter the maxRecordCount property refer to How To: Update the maximum record count for feature services in ArcGIS Online 

The maxRecordCount threshold does not affect statistics. For example, if you use !important to do a count of all hydrants, you will get the correct number.

Group By Summary Tables

Sometimes, you may want to include in your report a table that groups a statistic for your records. In our hydrant report sample, we may want to include a table to show how many inspections (count statistic) were performed by each inspector (grouped by inspector).  In SQL jargon, this would be possible with a GROUP BY query. 

This can be accomplished by adding a repeat section, with a filter that includes a GROUP BY. Here is what the syntax would look like for the hydrant report:

InspectorInspections performed
${#H_Inspection | stats:"count,objectid,inspectionCount":"Inspector": "" | where:"1=1" | orderByFields:"Inspector DESC" }${Inspector}${inspectionCount}${/}


A screenshot of the resulting report is below. The blue table at the bottom shows the inspections by inspector.  The complete reference for these types of filters can be found in Feature report queries—ArcGIS Survey123 | Documentation 

Other considerations and tips

No images or maps within a summary section

Summary sections have some limitations. You cannot include a map or a photo within a summary section. If you want to include maps or images in your report, just make sure you reference them from outside the summary section.

'Straighten' your quotes

A mix of straight (" ") and cursive (“ ”) quotes in your Survey123 report template syntax can generate syntax validation and/or execution errors. For consistency, I personally like to use always straight quotes: (") for double quotes and (') for single quotes.  Microsoft Word tends to replace straight quotes with cursive (also known as smart quotes), but you can change this behavior as described at Smart quotes in Word - Word 

Embed Fonts in Microsoft Word report template (if needed)

If the output PDF files generated by your template do not show fonts the way you expect them, embed fonts in your template as described at Embed fonts in documents or presentations - Office Support 

Pricing

If your survey is hosted in ArcGIS Enterprise, you can create as many reports as you like for free. If your survey is hosted in ArcGIS Online, your reports will consume credits. Here is how credits are calculated:

  • If your survey includes all Survey123 syntax within a summary section, the cost is 0.5 credits for the entire report. It does not matter how many records are included in your summary section. 
  • If your report does not have a summary section, or you use Survey123 syntax outside a summary section, the cost of the report in credits is the result of multiplying the number of selected records you are including in the report by 0.5.

Get Creative (Cover pages and more)

The focus focus of this blog has been to show how summary sections can be used to embed tables within your report. You can, however, use summary section in more creative ways. As we saw earlier on, the contents of a summary section are only processed once during a report request. For this reason, they also make a good candidate for you to create a cover letter for a report where you want to include multiple merged individual reports.

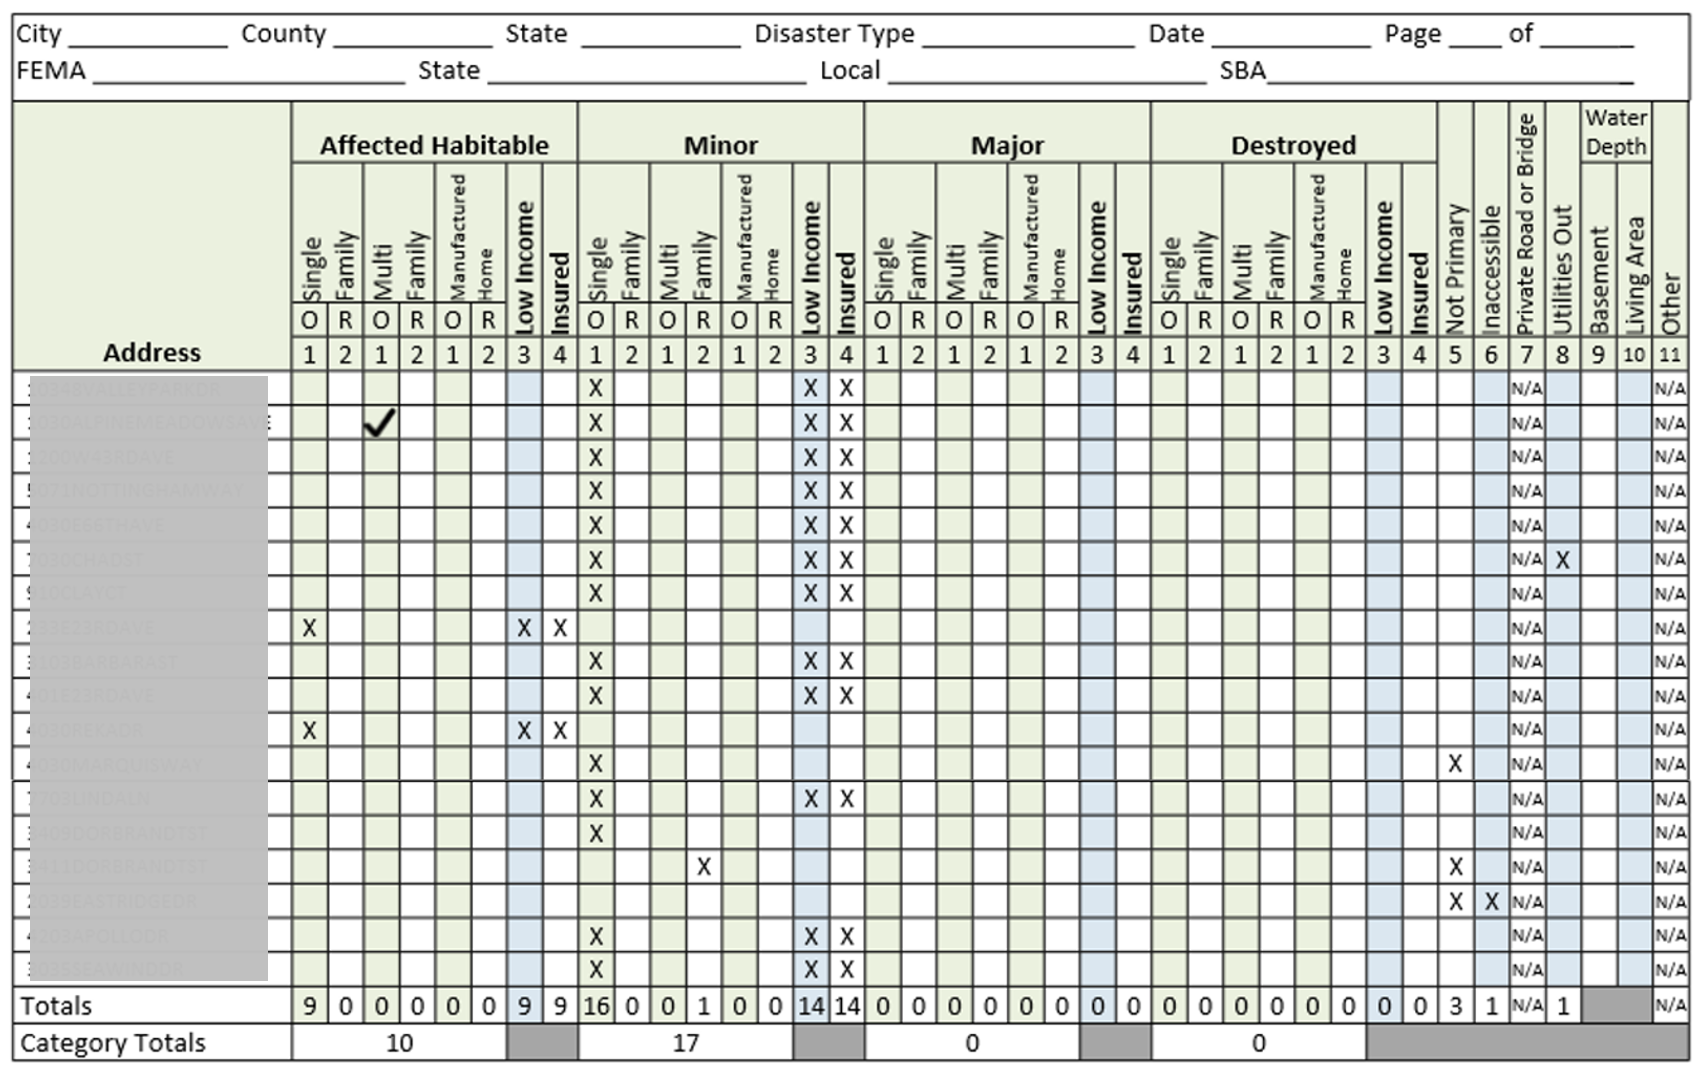
The Damage Assessment Summary report below also shows a creative use of a summary section. The report shows a list of addresses, which has been obscured on purpose in the screenshot. The grid uses check-marks to indicate the type of property and the severity of damage.  This report template uses conditional statements extensively to evaluate if a particular cell must be checked or not.  At the very bottom of the report you can also see totals and category totals. These values are all extracted using statistical functions described in this blog and the Survey123 documentation.

23 Comments
eMAPAdmin
New Contributor

I have a feeling that this Summary reports capability might remedy an issue that we encounter pretty frequently with building inspections but we haven't been able to figure it out quite yet and I was hoping you could provide some insight.

We have a singular report template that we wish to fill with responses from separate responses. For example: 7 inspectors show up to a building (Civil, Architectural, Electrical, etc.) and they all fill out the survey that only shows them questions that are pertinent to their discipline. Because it would be a logistical nightmare to have them all pass around one mobile device to fill out one iteration of the survey to get the ONE feature report, the inspectors submit their responses individually. Our client requires the strict one-report format that they provided so we've been having to create individual feature reports for each inspector, and then compile the singular report manually with the responses. What we really want is a one-click feature report that combines all responses from the inspectors in one singular document to limit the amount of office work required after the responses come in. 

I don't think this conundrum is unique to us, and I feel as though there is a way to accomplish what we need with the available tools (especially summary reports). Do you have any thoughts on this?

MattCreaney
Occasional Contributor

Hi Ismael Chivite

I'm trying to develop a few summary reports for a layer linked to a survey.  I'm having trouble getting different statistics to work.  Here's my report so far with highlighted notes:

$<$summary>Maintenance ITP

Date Range: ${Maintenance_ITP|where:"1=1"|stats:"min,inspection_datetime"|format:"DD/MM/YYYY"} - ${Maintenance_ITP|where:"1=1"|stats:"max,inspection_datetime"|format:"DD/MM/YYYY"} THIS SECTION WORKS

Record count: ${Maintenance_ITP|stats:"count,objectid"} THIS SECTION WORKS

FlumeGate Maintenance Count: ${Maintenance_ITP|where:"inspection_type='FlumeGate Maintenance'"|stats:"count,objectid,FGCount"} THIS SECTION RETURNS [object OBJECT]

SlipMeter Maintenance Count: ${Maintenance_ITP|where:"inspection_type='SlipMeter Maintenance'"|stats:"count,objectid,SMCount"} 

THIS SECTION RETURNS [object OBJECT]

Weather Station Inspection Count: ${Maintenance_ITP|where:"inspection_type='Weather Station Maintenance'"|stats:"count,objectid,WSCount"} 

THIS SECTION RETURNS [object OBJECT]

GMW SlipMeter Rework Count: ${Maintenance_ITP|where:"inspection_type='SlipMeter Rework'"|stats:"count,objectid,SRCount"} 

THIS SECTION RETURNS [object OBJECT]

GMW Sensor Upgrade Count: ${Maintenance_ITP|where:"inspection_type='Sensor Upgrade'"|stats:"count,objectid,SUCount"} 

THIS SECTION RETURNS [object OBJECT]

$</>

I'm trying to resolve the statements that aren't returning a count, but I'm not sure where the issue is.  The inspection_type field is correct and the table/layer is Maintenance_ITP.  I want to save a count variatble to reference later on in the summary report.

Whilst going through your blog I can see two different referenced layers - H_inspection and Redlands_Hydrants.  I do not understand why there are two different layers - could you please explain?

I also tried to follow along with the Hydrant Inspection sample in Survey123 Connect - but under "Community" I cannot find this survey.  Where can I get this please?

IsmaelChivite
Esri Notable Contributor

Hi,

 at first sight, it looks like to get the count of FlumeGate Maintenance records you could do something like this:


${Maintenance_ITP | where:"inspection_type='FlumeGate Maintenance'" | stats:"count,objectid"}

 I think the issue is that you are adding a third parameter after objectid that is not expected. The same fix could be applied to the other sections of your report.

 This is how you can get the Fire Hydrant community sample. Note that this survey has two layers in it: One for the hydrants, and one for the inspections. This is why you see a reference to H_Inspection in the blog post. It is just referencing that second table.

IsmaelChivite
Esri Notable Contributor

Hi. I think that it may be possible to do this, but before getting into details it may be best to discuss in more detail the specifics of the different inspections and how all data comes together into a single feature service. Please send an email to ichivite@esri.com so we can arrange a quick call and discuss options.

erica_poisson
Occasional Contributor III

Ismael Chivite

I am wondering if it is possible to calculate the statistic sum for multiple fields. 

I am attempting this syntax - ${WachusettSudbury_Region_Daily_Patrol_Log | stats:"sum,SumCMRViolations2a12" + "sum,SumParkTicket2a12"}

When I upload my report template, I do not get an error. I am also able to generate a report, however the output is: [objectObject].

I am wondering if this is not possible or if I am doing something wrong. 

Thanks!

by Anonymous User
Not applicable

@IsmaelChivite  I'm working on a summary report for pump station inspections.  I'm using a repeat tag to fill out the table which will insert a row for each pump station with it's summed inspection data.  I was able to get the syntax correct to sum the data for each question for each individual pump station.  But I'm struggling with how to show the most recent inspection date for each pump station.  

You'll see in my syntax I tried to use 'stats: max,REPDATE,InsDate' but that gives me the most recent inspection date of ALL the inspections.  I only want the most recent inspection date per pump station. I've tried shifting things around, but I keep getting errors and when I don't get an error I get the most recent date overall.


I inserted what I have so far for the report template table below.

$<$summary>

Station No.

Last Inspection Date

Pump #1 Run Hours

Pump #2 Run Hours

Total Run Hours

Bioxide Usage in/gals

Fuel Usage in/gals

Generator Run Hours

Electric Usage kWh

Water Usage gals

${#PumpStationLogs | stats:"count,FACILITYID;max,REPDATE,InsDate;sum,P1_RNHrs,SumP1;sum,P2_RNHrs,SumP2;sum,BIOXIDE,SumBiox;sum,GENERATOR,SumGen;sum, ELCTMTR_R18,Electric;sum, H2OMTR_R18,SumWater":"PSNAME": "" | where:"1=1" | orderByFields:"PSNAME ASC" }${PSNAME}

${InsDate | format:"DD/MM/YYY"}

${SumP1|round:2}

${SumP2|round:2}

${SumP1+SumP2}

${SumBiox| round:2}


${SumGen|round:2}

${Electric|round:2}

${SumWater|round:2}${/}

$</>

by Anonymous User
Not applicable

@erica_poisson did you ever sort out a solution to "I am wondering if it is possible to calculate the statistic sum for multiple fields"? I am running into the exact same issue.

erica_poisson
Occasional Contributor III

@Anonymous User ,

I did not figure out how to do this within the summary report template, however I do use coalesce functions inside my survey to do this and that works well. 

TrishaSchlake
New Contributor III

@IsmaelChivite 

Is it possible to include multiple where statements based on two fields like you can have multiple statistics? If so, what is the syntax for that? 

BenBaker1
Occasional Contributor

@IsmaelChivite ,

Is there any plans for incorporating a single map into a summary section. We're working on a project that would drop locations of bulk waste/brush to be picked up using QuickCapture. I want to take all of those locations and put them on a single map, along with a list of addresses that has been reverse geocoded from the QuickCapture points. I have the summary table set up to create the list of addresses, but I'd like a map that shows all of the points on a map so they can plan their route to pick up at each location. Currently, the drivers don't have the ability to use Survey123 or Workforce to mark a pile as picked up.


Another obstacle I just encountered is how to automate a summary report in Integromat when a "survey" is not being submitted. if the points are created using QuickCapture, then I want to print a list of locations to be picked up for the driver, how might I go about creating that summary report through Integromat?

Sample report template:

BenBaker1_0-1618328383237.png


JamieLambert
Occasional Contributor III

@IsmaelChivite is it possible to get a count of null values? Through the report functionality - without modifying the dataset...

The documentation says "To get the statistic, you need to pass the statistic you want (sum, max, min, count, avg) and also the field on which you want to calculate the statistic. Records with null values will be ignored."

We have a large dataset and are primarily using Survey123 via the Inbox to update records and leveraging reporting functionality.

We would like to see how many records (based on a filter) have yet to be updated/categorized. For example, if we have 100 sites to inspect - 50 pass 15 fail and 35 still require inspection (i.e. have no value assigned). In this case its easy enough to work it out, but when we are looking at thousands of records and multiple categories, its not as simple.

This is a key statistic for our summary reports. Thanks.

Jamie.

MichaelBruening
Occasional Contributor

Hello, I have a survey that contains a repeat which is 3 levels deep. Parent, Repeat1, Repeat2, Repeat3, which contains data that I would like to utilize within a Summary Section of a Custom Report. I have three questions that are going to drive the summary table listed below -

Question1 contains 3 dozen choices that categories a main category,

Question2 contains 4 choices relating to the condition of the finding in Question1 – Condition1, Condition 2, Condition 3, and Condition 4, and

Question3 contains 3 choices relating to a status rating of the finding in Question 1 – Status1, Status2, and Status3.

Question4 contains 2 values or “0” or “1” which are assigned based on answers to Questions1. If Question1 = “Choice 36”, then “0” otherwise “1”. I had planed on using this within a pivot table for summaries.

The end goal for the Summary table would look something like this table below.


MichaelBruening_0-1625061449704.png


However, I can only seem to get to this stage of the game and there is an issue with the results of this table. I have tried multiple combinations of queries, but the stats are being pulled for the "entire" repeat and not just the specific parent record report that I have chosen?

MichaelBruening_1-1625061449704.png

This is the query that I came up with based on the information from the “Group by summary Tables section of this article.

MichaelBruening_2-1625061449705.png

${#Repeat3 | stats:"sum,Question4,Question4Sum;count,Question2,Question2Count":"Question1": "" | where:"1=1" | orderByFields:"Quesiton1 ASC" }${Quesiton1}

MichaelBruening_3-1625061449705.png

However, this pulls data for “ALL” records within Repeat3. I would like for the values being reported only be based the Repeat3 records that are related to the selected Parent record.

So, I tried to use the information to “Limit the repeat block to selected Question1 records that have a Question2 = ‘Value1’ of within this online help section https://community.esri.com/t5/arcgis-survey123-blog/survey123-tricks-of-the-trade-summary-sections-i...

MichaelBruening_4-1625061449706.png


I would leave the Custom Report Summary table the same as above, but I would substitute this within the block below the ${#Repeat3 | stats:"count,objectid,Question2_Status1" | where:"Question2 = 'Status1'"}${Question2_Status}${/}

Everything will check out when uploading the custom report, but when I attempt to export the report there is either an error of “Failed to convert to PDF” or when using the export to Word Document the doc is corrupted.

Here is what I used within the table below.

${#Repeat3 | stats:"sum,Question4,Question4Sum":"Question1": "" | where:"1=1" | orderByFields:"Quesiton1 ASC" }${Quesiton1}

${#Repeat3 | where:"Question3 = 'Status1'" | stats:"count,objectid"}${/}

${#Repeat3 | where:"Question3 = 'Status2'" | stats:"count,objectid"}${/}

${#Repeat3 | where:"Question3 = 'Status3'" | stats:"count,objectid"}${/}

MichaelBruening_5-1625061449707.png

Any insight to achieving the end summary table would be greatly appreciated.

Thank you,

Mike

by Anonymous User
Not applicable

@MichaelBruening As far as I can tell this is not possible with these forms. I think I am trying to do the exact same thing with damage assessment data. If you figured it out, please prove me wrong since I am still looking for a solution. I will have to use something other than Survey123 reports.

Here is the Community post I created and have not received answers to:

https://community.esri.com/t5/arcgis-survey123-questions/survey123-summary-report-filter-attributes/...

MichaelBruening
Occasional Contributor

@Anonymous User I have not figured out this report matrix functionality and had to go a different route for the report. Sorry on the delayed response.

by Anonymous User
Not applicable

@MichaelBruening  No problem. Thanks for responding. I had my own posting about it and got no responses. I have decided to go another route as well. I considered Crystal reports, but will probably try Power BI first.

LinzMess
New Contributor II

@IsmaelChivite I have modeled a report using summary sections off your example (thank you!). Is there a way when you have multiple tables for data to hide a table that contains no data. For example, in your post, you have separate tables for water hydrants requiring maintenance and water hydrants in good condition. If there are no hydrants in good condition, the table header row for that table still appears. Is there a way to only display a table if it contains data?

MattReeves_SpokaneValley
New Contributor III

@IsmaelChivite Is there a way to show the initial date range selected and the initial Filters configured in the Data tab on the Summary Report?

For instance: I have created a '7 day report', where the user selects the 7 days they are interested in, and then Filters results to their InspectorName, and then runs the report. I show MIN InspectionDate, and Max InspectionDate on the Summary Report, but sometimes this only covers 3 days, since they perhaps didn't do any inspections the first 2 days, nor the last 2 days of the 7 day period. But, it is still nonetheless a 7 day report over the 7 selected days, it just doesn't read that way in the report.


Thanks,


Matt

ChristopherDawe
New Contributor III

@IsmaelChivite  This is a really useful blog thankyou, however i have a workflow that i cannot seem to get right at the moment. I note in your text above that it says that no images or maps can be included within a summary section, howver at the following link it appears that they can be:

https://doc.arcgis.com/en/survey123/browser/analyze-results/featurereportqueries.htm  ..."If a map is included in a summary section, it will print all geometries of all input records on a single map. "

I have a survey where the main questions are to record overall details about a site visit and then there is a repeat which includes individual records about notes on that site which would include a map, a photo and some accompanying text. Ideally i would like to create a report that shows the overall answers first then the repeat spitting out each individual answer and finally use a summary section to create a map showing the location of all the individual repeat records on one map rather than just using a map for each one inside the repeat section of the report. 

Do you know if this is possible with the current syntax?


Thansk

Chris

JedJackson
New Contributor III

@IsmaelChivite. Great article and great resource.  I have a survey where people can put in several records of Bycatch throughout a month (site, date, Fish species and number released and number died etc).  I want to create an aggregate report to summarize by site, year, month, Fish Species, and total number released and total mortalities.   As such I have a summary report that I created to aggregate all the fields from the original survey by grouping them by a sortfield (a concatenation of Site, Year, Month, FishSpecies) to give distinct values.  This works great to populate the data table needed on 11/12 fields of various types (like facility #, site Name, Date, Month, Year, FishSpecies, OtherSpecies, sum Mortalities, sum Released, comments), using min stats for both text and dates etc. Syntax is verifying and report produces without errors, also gives me what I am looking for results for  11/12 fields except one field will not populate (FishSpecies).  I have tried first, last, min and max stats (last is the only stat that does not seem to crash table when creating) on this text field and it still will not populate, yet field beside OtherSpecies is also text and populates completely fine with min stat.  Any help will be greatly appreciated, as I know I am pushing boundaries with aggregating text fields and cannot see tons of documentation in that regard.

here is the first column of the summary table that works out all the stats:


${#Report_Details|stats:"min, Facility_Ref_Nbr, Ref_Nbr; min,Facility_Name, Name; min, Sort_Concat, Sortfield; min, Date_of_Catch,DateCatch;min, Month_Of_Catch, Month; min, Year_Of_Catch, Year; last, Species_Common_Name, Spp;
min, Other_Species, OtherSpp; sum,Released_Pieces, sumReleased; sum, Mortalities_Pieces, sumMort; avg, Ave_Weight, aveWeight; min, Comments, Comms":"Sort_Concat"|where: "Event_Type='Carcass_Recovery'"|orderByFields:"Sort_Concat ASC"}${ Ref_Nbr}


then I have a table with a column for each aggregate field

${Name}

${Sortfield}

Carcass Recovery

${DateCatch}

${Month}

${Year}

${Spp}

${OtherSpp}

${sumReleased}

${sumMort}

${aveWeight}

${Comms}${/}


In the survey Name, Spp are both Choice fields in the xlsForm, whereas OtherSpecies is just open text box.  so not sure why I can pull min Name, and min OtherSpecies but not min Spp.


End table looks like this (some information has been changed for privacy reasons). I would like Species Common Name field to have the fish species populate (i.e. record 1 would be Copper Rockfish).

JedJackson_1-1680804425614.png


StevenDel_Castillo
New Contributor III

Just to confirm, summary reports are only available for survey forms that contain repeats? We are needing a report to summarize single point submissions in one page (survey form contains no repeat sections). 

RobertAnderson3
MVP Regular Contributor

@StevenDel_Castillo You do not need a repeat to have a summary report, it is definitely possible to summarize multiple single point submissions into a single report. I have one set up that I use to summarize submissions weekly (I use Power Automate to automatically generate the report, but the report template is there and available to use on any selection of multiple entries). Seems I can't attach files here so here's a screenshot of what I have set up.

RobertAnderson3_0-1710333023724.png


StevenDel_Castillo
New Contributor III

@RobertAnderson3 Awesome! Glad to know it was user error on my part.

We're using Make (formerly Integromat) for our automated report generation and I am curious about Power Automate. Are you running your summary reports on a schedule basis (i.e. 1st of every month)?

RobertAnderson3
MVP Regular Contributor

@StevenDel_Castillo I am running them on a schedule basis yeah, I haven't used Make, only Automate.

The example I shared is running on a weekly basis, scheduled every Saturday night, it has a where clause to pick out any entries where the asset needed maintenance to provide a summary. I'm sure you could set it to be the 1st of the month or such as well.

One thing to note with Automate (I'm not sure if it's the same on Make) is there is a 14 day timeout on the token so Survey123 access, so you need to refresh the log in (super simple, just a nuisance).