- Home
- :
- All Communities
- :
- Products
- :
- ArcGIS Survey123
- :
- ArcGIS Survey123 Blog
- :
- Survey123 Tricks of the Trade: Ranking question an...
Survey123 Tricks of the Trade: Ranking question and choice randomization
- Subscribe to RSS Feed
- Mark as New
- Mark as Read
- Bookmark
- Subscribe
- Printer Friendly Page
- Report Inappropriate Content
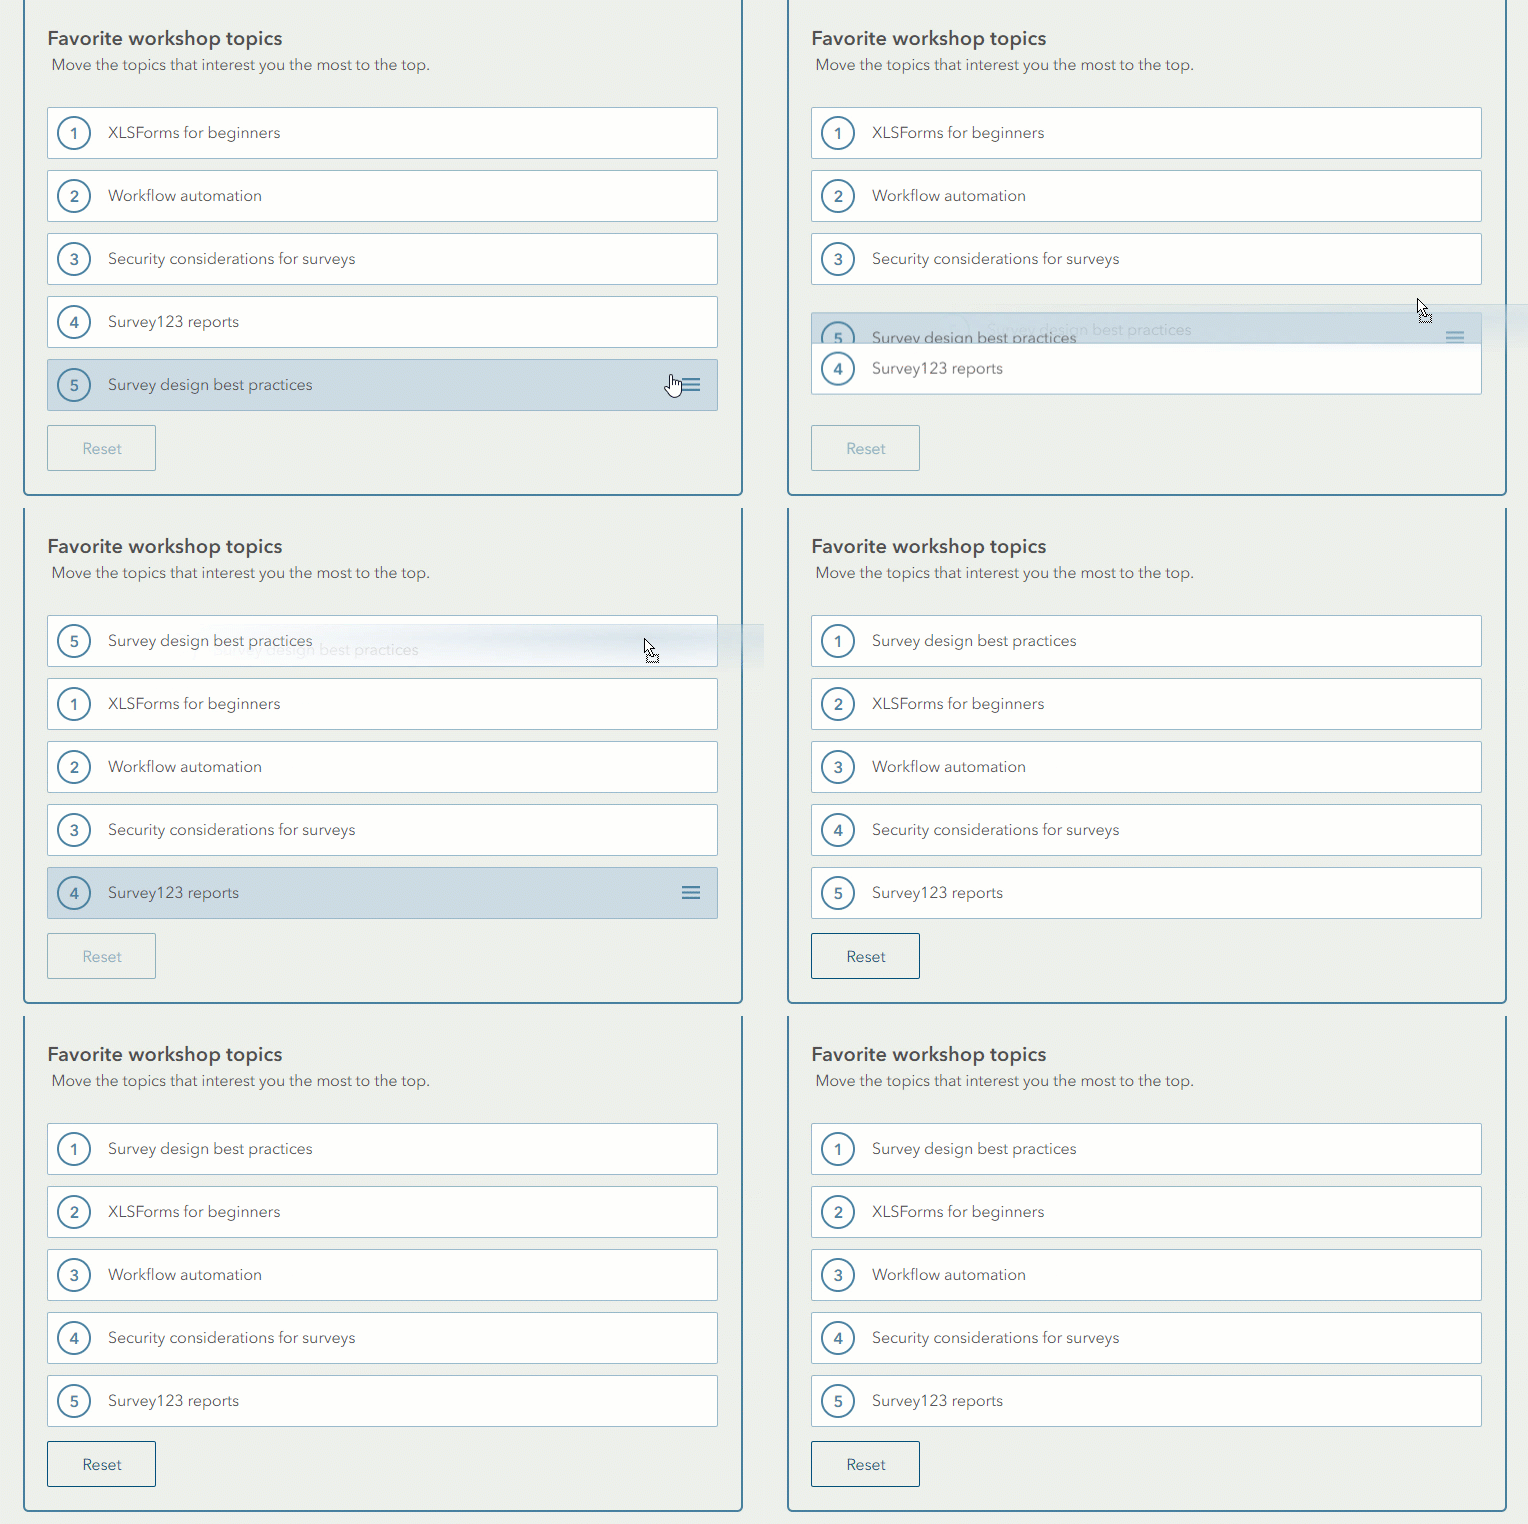
The ranking question lets people sort items in a list in order of preference. Here is an example where we ask respondents to rank a series of topics for an upcoming Survey123 workshop. Note how the ranking of a topic in the list can be changed by simply dragging it to the desired position. Users promote their favorite topics to the top of the list.

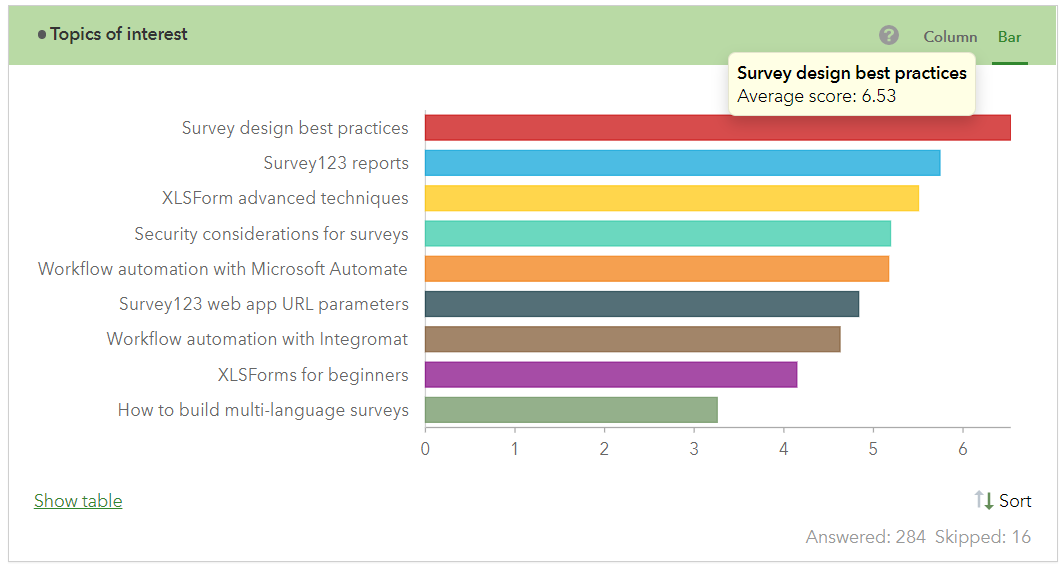
As the user submits the survey, choices in the ranking question are scored accordingly to their position in the list: The higher in the list, the higher the score. Survey123 lets you analyze survey responses to understand the average and variance of the scores for each item. The chart below shows preferences showed by respondents. The "Survey123 design best practices" ranked first with an average score of 6.53, followed by the "Survey123 reports" topic.

The Ranking question is a great resource anytime you want to measure people's preferences over a list of well defined choices.
This blog post describes how you can create your own Ranking questions with Survey123. It first presents how you can add this type of question using Survey123 designer. It then shows how you can explore results from the Survey123 website and ultimately, how you can use XLSForms to use this question type in Survey123 Connect.
Adding a Ranking question in the Survey123 designer
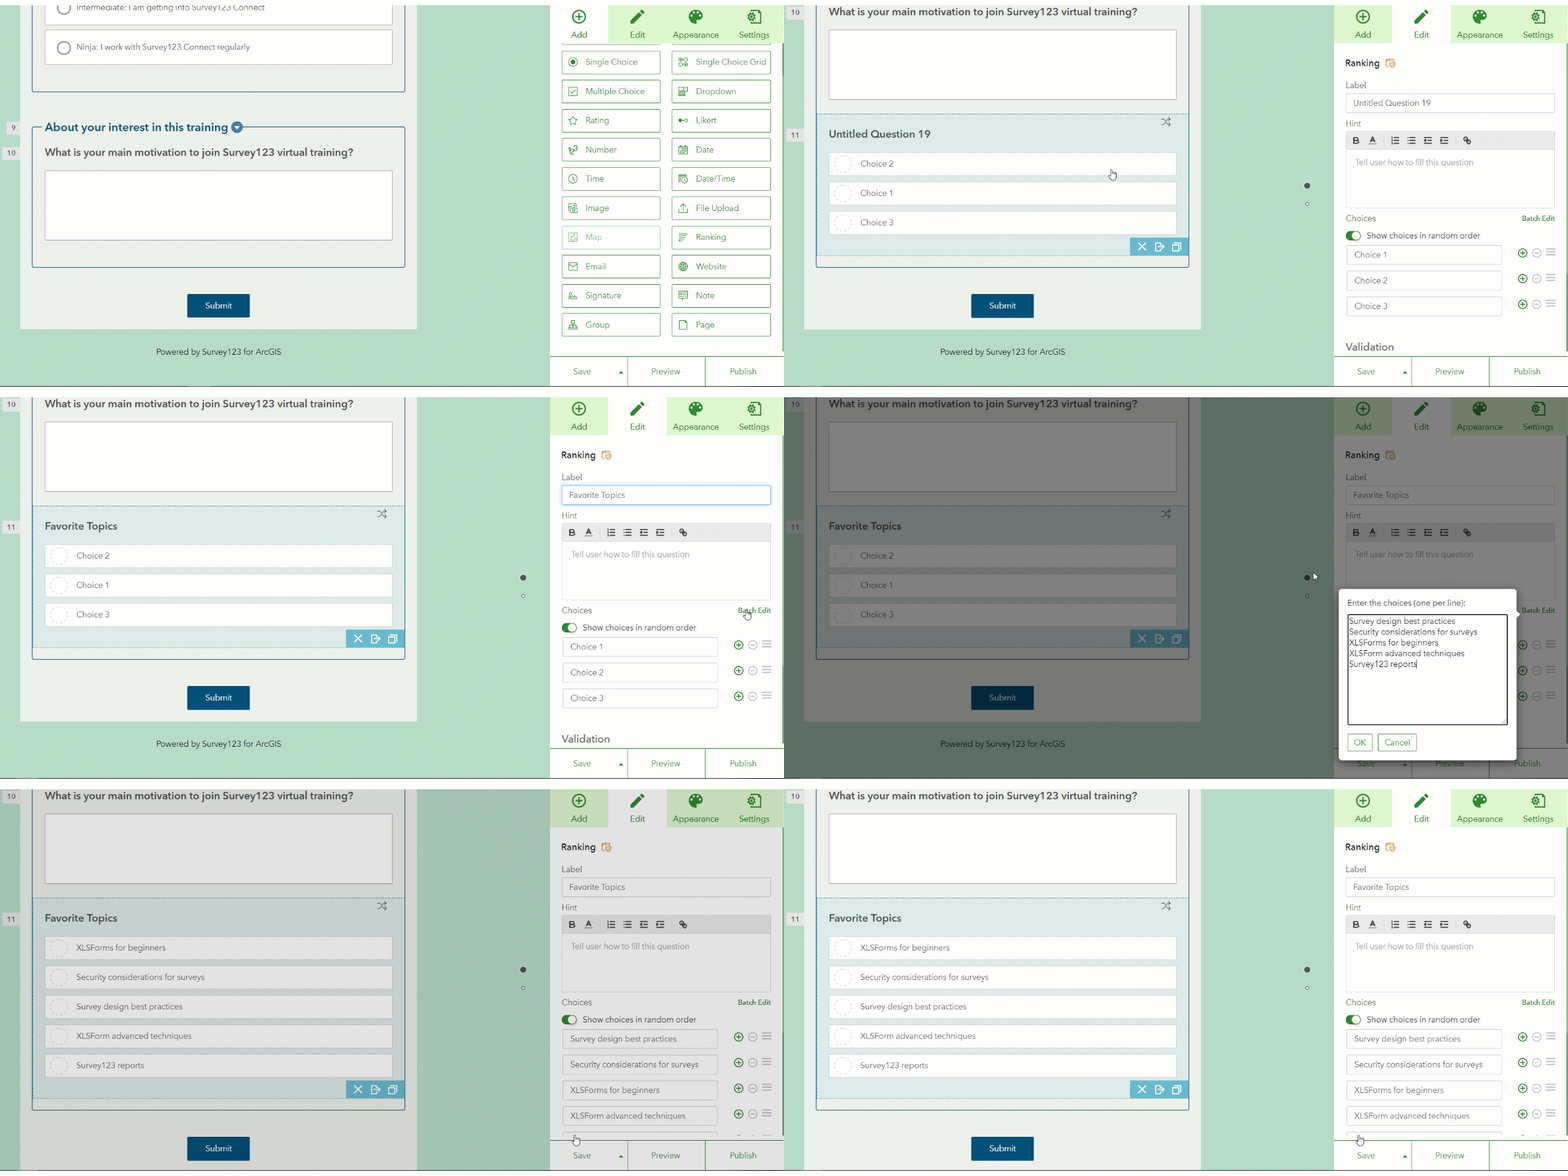
The Survey123 web designer lets you visually build your own surveys from a web browser. To add a Ranking question to your survey, drag it into the design preview. You can interactively add choices to the list, or add them in bulk as shown in the animation below.

Adding too many choices to a Ranking question will be overwhelming to users. It is recommended that you do not add more than 6 choices.
Choice randomization
It's human nature that people tend to either favor whatever choices are presented first (primacy effect) or last (recency effect). To avoid biased responses, you may want to randomize how choices are initially presented to the user. In Survey123, you can choose to randomize choices in all types of lists (dropdown, choice lists, checklists...). Randomization is particularly useful for the ranking question. In the Survey123 web designer, you will find a 'Show choices in random order' option. It will be enabled by default when you add a new Ranking question, but you can choose to disable it.
Analyzing rank results
As the user submits the survey, choices in the Ranking question are scored. Here is how scoring works: If you have 5 choices in your list, the choice at the top gets a score of 5, the choice after that a 4, etc. If you have a list with 7 choices, the one at the top gets a score of 7... You get the point.
When you look at the results of your survey in the Survey123 website, you will be presented with a chart and a table. The chart sorts your choices using the average score. It also shows you the number of responses, and the number of times the question has been skipped (if appropriate). Here is an example. This chart will give you insight as to who are the winners, overall.

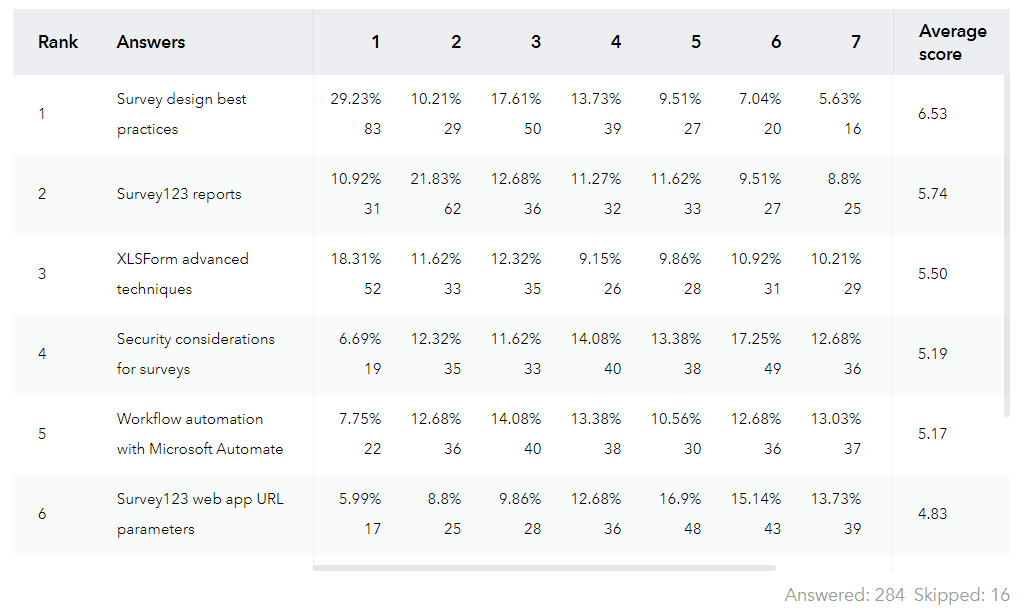
The table is useful to understand the variance of the rankings. The table indicates what the average score is, and how many times a particular choice was ranked at each position. For example, in the table below we see that the 'Survey123 design best practices' topic was selected as the top choice by 83 of the respondents (almost 30%). We also see that while 'XLSForm advanced techniques' ranked third position, it was chosen as the first choice by a larger group than 'Survey123 reports', which ranks second. This tells us that on average, the Survey123 reports topic is more popular than 'Advanced Techniques', but proponents of 'Advanced Techniques' care proportionally more about the topic.

If you were to look at the raw data stored in your GIS records, the output of a rank question is a comma separated list of values. The first value in the list is the top choice for that record, followed in descending order by the rest.
Ranking questions in Survey123 Connect
If you work with Survey123 Connect, you can also add ranking questions. Use the rank question type and assign it a list from your choices worksheet. The syntax is similar to that of select_one and select_multiple questions, but you use rank instead. If you want to randomize the choices, set the parameters value to randomize=true. It could look something like this:
| type | name | label | parameters |
|---|---|---|---|
| rank topics | topics_ranked | Favorite topics | randomize=true |
Ranked choices are stored as a comma separated list of choice names.
banana, apple, orange, kiwi
The comma-separated list of values honors the order of the user selection. In the example above, banana was placed at the top, followed by apple, orange and kiwi.
Keeping this in mind, you can do a few clever things with XLSForms. A common request is to be able to store the score of each choice as an attribute. Here is what I mean. Note how the scores for the fruits automatically calculate as the choices are ordered:

Once you know how to get the score of an item, you can use these values to implement your own custom validation or skip logic.
Getting the score values can be accomplished with the help of a simple JavaScript function and pulldata. If you are not familiar with using custom JavaScript functions with XLSForms, seehttps://community.esri.com/groups/survey123/blog/2020/08/07/extending-survey123-smart-forms-with-cus...
Here is what the XLSForm could look like:
| type | name | label | calculation | parameters |
|---|---|---|---|---|
| rank fruits | fruits_rknd | Favorite fruits | randomize=true | |
| calculate | banana | Banana | pulldata("@javascript","myJS.js","getScore","banana",${fruits_rnkd}) | |
| calculate | apple | Apple | pulldata("@javascript","myJS.js","getScore","apple",${fruits_rnkd}) | |
| calculate | kiwi | Kiwi | pulldata("@javascript","myJS.js","getScore","kiwi",${fruits_rnkd}) |
And here is a JavaScript function to back it up:
function getScore (fruit, ranked_fruits)
{
var fruits = ranked_fruits.split(',');
return fruits.indexOf(fruit) + 1;}
You must be a registered user to add a comment. If you've already registered, sign in. Otherwise, register and sign in.