Turn on suggestions
Auto-suggest helps you quickly narrow down your search results by suggesting possible matches as you type.
Cancel
- Home
- :
- All Communities
- :
- Products
- :
- ArcGIS StreetMap Premium
- :
- ArcGIS StreetMap Premium Questions
- :
- point or kernel density but which classification m...
Options
- Subscribe to RSS Feed
- Mark Topic as New
- Mark Topic as Read
- Float this Topic for Current User
- Bookmark
- Subscribe
- Mute
- Printer Friendly Page
point or kernel density but which classification method?
Subscribe
6994
1
08-25-2013 07:03 AM
by
Anonymous User
Not applicable
08-25-2013
07:03 AM
- Mark as New
- Bookmark
- Subscribe
- Mute
- Subscribe to RSS Feed
- Permalink
Original User: firefry82
Hi, first of all I want to say that I already have done a lot of reading about this, but I still think I'm missing something obvious.
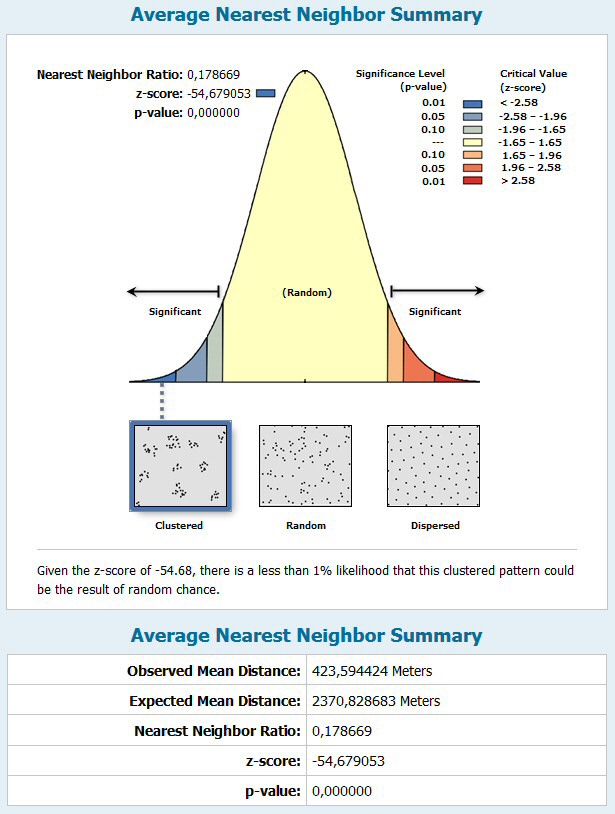
I have point data, about 1200 points distributed over a large area (approx. 20,000 square kilometres). They are clearly clustered. You can see it with the naked eye and average nearest neighbor says so too. Now what I want to do is, I want to determine areas which contain a significantly higher density of points. These areas shall act as my study areas. So what I tried was this
:
1) ran an "average nearest neighbor" on my original data
[ATTACH=CONFIG]26947[/ATTACH]
2) built a model which first copies, than integrates the original data then collects events. I used the outcome (423,594424 meters) as tolerance for the integrate-tool.
3)ran a new "average nearest neighbor" on the result from my model (point 2)
4)startet "Incremental Spatial Autocorelation" (Spatial Statistics) (Morans I) with 1000 meter steps (increments) starting at 2877,357147 (result from point 3).
this is the result:
[ATTACH=CONFIG]26948[/ATTACH]
so the first peak is at 18877,36 meters (zscore=1,929998 und pvalue 0,05)
5) Now I ran "point density tool" (and kernel density, too) with 18877,36 meters as radius.
So far so good. But here comes my problem:
Depending on what classification method I use, the outcome differs greatly!!
Remember I wanted to use the most dens areas to determine my study areas. If the outcome differs so greatly I cannot do that I guess. Which classification method should I use? The data is not normal distributed and not linear. I tried standard deviation and quantiles, but I can still influence the outcome very much. I need some kind of statstical tool or formula that tells me where there is a clear break in the density data. Can anybody help me with that?
I'm using arcgis 10.1 with all licenses
this is what my point density looks like with different classification methods:
[ATTACH=CONFIG]26949[/ATTACH]
and they all still contain the zero values. If I cut them away (by excluding them), which I am not the least bit sure if I should do or not, then it all changes again...
[ATTACH=CONFIG]26950[/ATTACH]
Hi, first of all I want to say that I already have done a lot of reading about this, but I still think I'm missing something obvious.
I have point data, about 1200 points distributed over a large area (approx. 20,000 square kilometres). They are clearly clustered. You can see it with the naked eye and average nearest neighbor says so too. Now what I want to do is, I want to determine areas which contain a significantly higher density of points. These areas shall act as my study areas. So what I tried was this
:
1) ran an "average nearest neighbor" on my original data
[ATTACH=CONFIG]26947[/ATTACH]
2) built a model which first copies, than integrates the original data then collects events. I used the outcome (423,594424 meters) as tolerance for the integrate-tool.
3)ran a new "average nearest neighbor" on the result from my model (point 2)
4)startet "Incremental Spatial Autocorelation" (Spatial Statistics) (Morans I) with 1000 meter steps (increments) starting at 2877,357147 (result from point 3).
this is the result:
[ATTACH=CONFIG]26948[/ATTACH]
so the first peak is at 18877,36 meters (zscore=1,929998 und pvalue 0,05)
5) Now I ran "point density tool" (and kernel density, too) with 18877,36 meters as radius.
So far so good. But here comes my problem:
Depending on what classification method I use, the outcome differs greatly!!
Remember I wanted to use the most dens areas to determine my study areas. If the outcome differs so greatly I cannot do that I guess. Which classification method should I use? The data is not normal distributed and not linear. I tried standard deviation and quantiles, but I can still influence the outcome very much. I need some kind of statstical tool or formula that tells me where there is a clear break in the density data. Can anybody help me with that?
I'm using arcgis 10.1 with all licenses
this is what my point density looks like with different classification methods:
[ATTACH=CONFIG]26949[/ATTACH]
and they all still contain the zero values. If I cut them away (by excluding them), which I am not the least bit sure if I should do or not, then it all changes again...
[ATTACH=CONFIG]26950[/ATTACH]
1 Reply
08-28-2013
03:21 PM
- Mark as New
- Bookmark
- Subscribe
- Mute
- Subscribe to RSS Feed
- Permalink
I think this is where you get to use your judgement and use the classification method that's practical for defining your study areas. You have done the work of identifying the high density areas using an objective approach (showing that the data are clustered and using point density or kernel to identify the areas). Now it seems you can decide which classification method makes sense for your study, and be consistent if there will be more data in the future.