Turn on suggestions
Auto-suggest helps you quickly narrow down your search results by suggesting possible matches as you type.
Cancel
- Home
- :
- All Communities
- :
- Products
- :
- ArcGIS Spatial Analyst
- :
- ArcGIS Spatial Analyst Questions
- :
- Re: Why the extra classes when I reclassify a rast...
Options
- Subscribe to RSS Feed
- Mark Topic as New
- Mark Topic as Read
- Float this Topic for Current User
- Bookmark
- Subscribe
- Mute
- Printer Friendly Page
Why the extra classes when I reclassify a raster?
Subscribe
9255
4
04-04-2012 06:45 AM
04-04-2012
06:45 AM
- Mark as New
- Bookmark
- Subscribe
- Mute
- Subscribe to RSS Feed
- Permalink
When I run "reclassify," I always get extra classes that I don't want. I am making sure to include the max and min values of the raster when I reclassify. What's going on here?
4 Replies
04-04-2012
10:18 AM
- Mark as New
- Bookmark
- Subscribe
- Mute
- Subscribe to RSS Feed
- Permalink
When I run "reclassify," I always get extra classes that I don't want. I am making sure to include the max and min values of the raster when I reclassify. What's going on here?
Are you getting these extra class when running reclassify for various datasets? How about when you check on "Change missing values to NoData"?
05-21-2012
09:06 AM
- Mark as New
- Bookmark
- Subscribe
- Mute
- Subscribe to RSS Feed
- Permalink
Julia & Prasanta,
I am including this post so people searching for this problem can know that the solution offered seems to work. Thanks Prasanta for the tip!
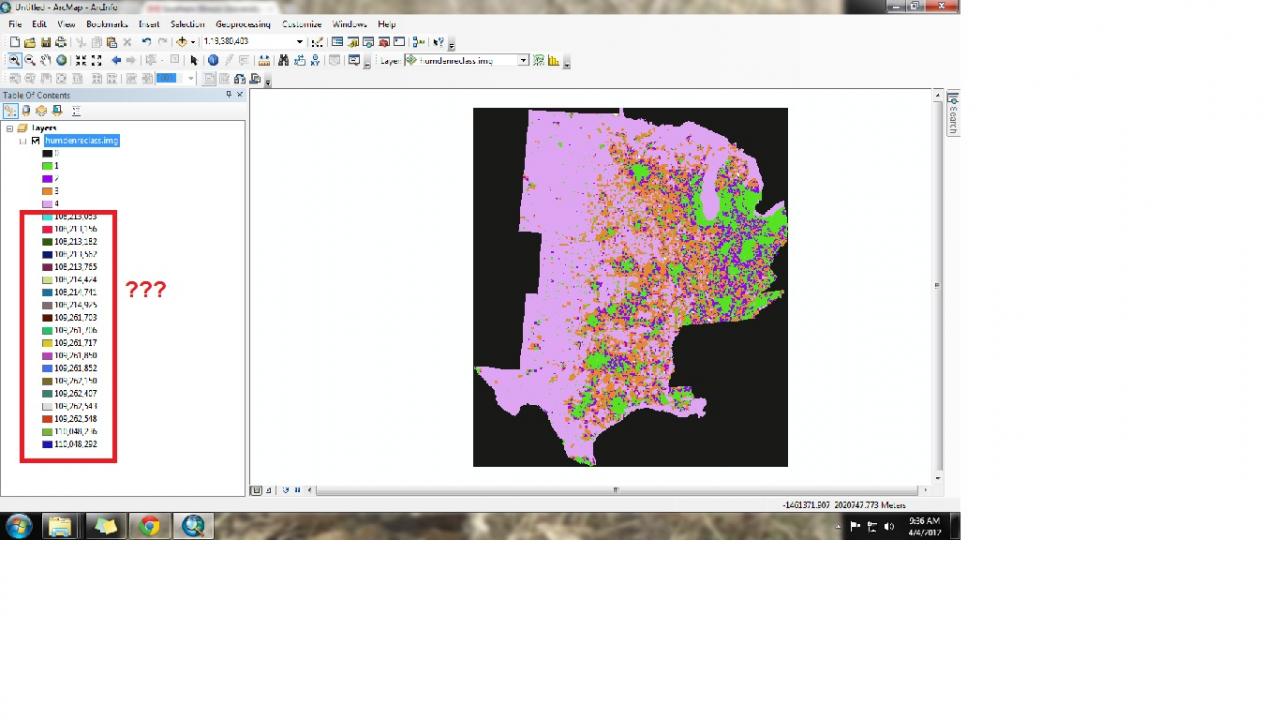
I think this is the first time I have tried to use the reclassify tools in ArcGIS 10 so it comes as a surprise that they don't seem to be working. I have a raster that I am trying to reclassify to exclude 0 (zero) values. I launch the Reclassify tool, add the Raster (.img) I see that there should be 7 values but when I run the tool I get a raster with 15 values. I tried Prasanta's advice and selected the "Change missing values to NoData (optional)" box and that seemed to do the trick. I would like to know why this is necessary though as I don't recall ever having to do this in the past.
I am including this post so people searching for this problem can know that the solution offered seems to work. Thanks Prasanta for the tip!
I think this is the first time I have tried to use the reclassify tools in ArcGIS 10 so it comes as a surprise that they don't seem to be working. I have a raster that I am trying to reclassify to exclude 0 (zero) values. I launch the Reclassify tool, add the Raster (.img) I see that there should be 7 values but when I run the tool I get a raster with 15 values. I tried Prasanta's advice and selected the "Change missing values to NoData (optional)" box and that seemed to do the trick. I would like to know why this is necessary though as I don't recall ever having to do this in the past.
05-30-2012
07:28 AM
- Mark as New
- Bookmark
- Subscribe
- Mute
- Subscribe to RSS Feed
- Permalink
Please follow the knowledge base article I'm linking to and let us know if it resolves the issue with extra classes. Do not change missing values to NoData.
HowTo: Compute the histogram with all the unique values, when using the classified renderer
The Reclassify tool relies on the same histogram calculation.
Regards,
Eric
HowTo: Compute the histogram with all the unique values, when using the classified renderer
The Reclassify tool relies on the same histogram calculation.
Regards,
Eric
06-04-2012
01:16 PM
- Mark as New
- Bookmark
- Subscribe
- Mute
- Subscribe to RSS Feed
- Permalink
It is important to note for those of you finding this issue that the extra classes are a result of input values not being accounted for in the input reclassification table (remap). Whether entered manually, provided by default, or through the available tool classification methods.
For the case defined in this post, the input raster is a floating point raster with many unique values. The method of creating the remap was based on an estimated histogram, which calculated a minumum and maximum not equivalent to the actual range of values in the input raster. Therefore, not all input values were correctly classified, and by default, missing values in the reclass table retain their input value (the option is to map them to NoData), hence the extra output values.
To correctly classify your data your options are to,
1) manually edit your reclassifcation table range of values and provide the correct break values (including the actual maximum).
2) use Windows registry setting to calculate the histogram using all unique values (as mentioned in the KB article by Eric). Please note this may take extra time depending on the size of your dataset.
3) if the desired output is a sequential range of values (ie, 1-9) you can try the Slice tool.
We will work to find a way to provide you with the most accurate reclassification table by default, in the mean time hope this helps you get your work done.
Regards,
-Ryan