Turn on suggestions
Auto-suggest helps you quickly narrow down your search results by suggesting possible matches as you type.
Cancel
- Home
- :
- All Communities
- :
- Products
- :
- ArcGIS Spatial Analyst
- :
- ArcGIS Spatial Analyst Questions
- :
- Raster calculator divide creates anomalous data
Options
- Subscribe to RSS Feed
- Mark Topic as New
- Mark Topic as Read
- Float this Topic for Current User
- Bookmark
- Subscribe
- Mute
- Printer Friendly Page
Raster calculator divide creates anomalous data
Subscribe
4855
5
04-07-2011 02:55 PM
04-07-2011
02:55 PM
- Mark as New
- Bookmark
- Subscribe
- Mute
- Subscribe to RSS Feed
- Permalink
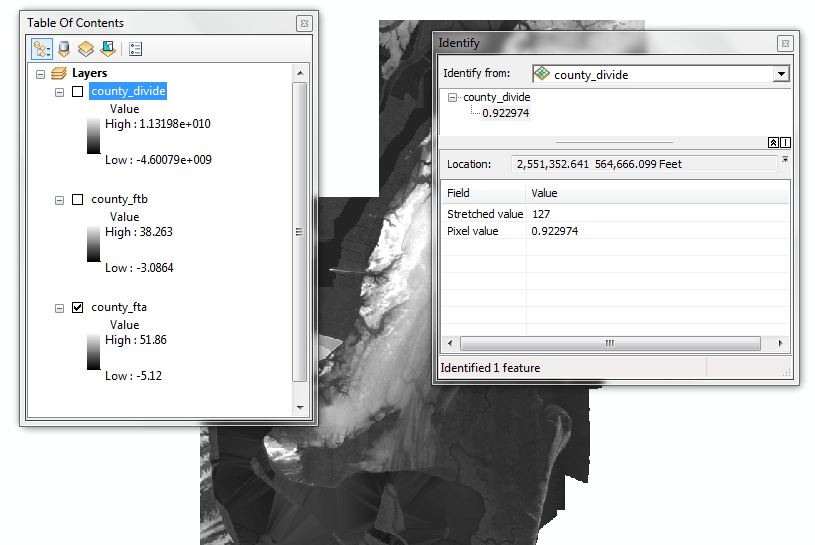
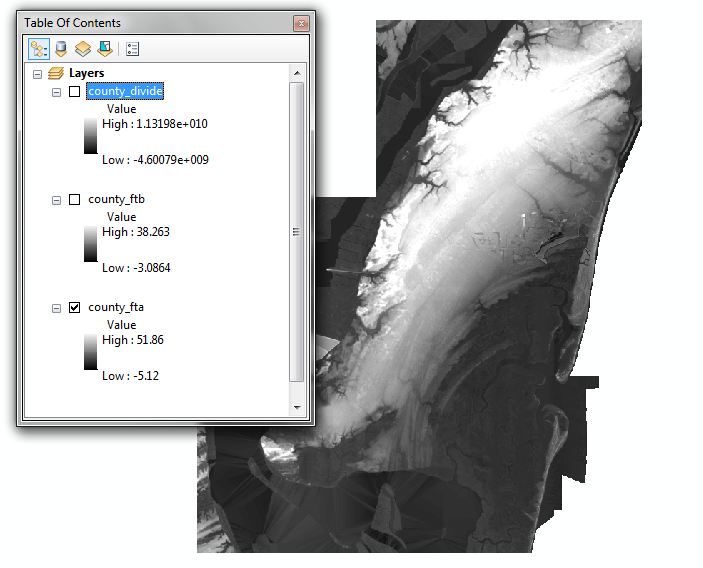
I have two 32bit float rasters that behave normally with all raster calculator functions except divide. If I divide raster1/raster2 the resulting raster has an anomalous range listed in the TOC. However, it stores the correct ratio value in the created raster which can be determined by using the identify tool. I've included two photos to display this. county_fta/county_ftb = county_divide The first photo shows the displayed range of the data (county_divide) which is incorrect and further calculations use these data instead of the correct ones that are contained within. The second photo shows the identify tool showing a normal data point chosen randomly. Any help greatly appreciated!
5 Replies
04-07-2011
05:09 PM
- Mark as New
- Bookmark
- Subscribe
- Mute
- Subscribe to RSS Feed
- Permalink
have your ruled this out as simply being a symbology issue? have you tried to float one of the rasters in the raster calculator prior to division to ensure floating point division? Have you investigated the histogram for the data?
by
Anonymous User
Not applicable
04-08-2011
08:00 AM
- Mark as New
- Bookmark
- Subscribe
- Mute
- Subscribe to RSS Feed
- Permalink
Original User: whuber
The output looks correct to me--there's nothing anomalous about the range, because the denominator includes both negative and positive numbers. That suggests it may contain numbers close to zero. Dividing by them will produce values of large size (potentially above 10^30), both positive and negative.
The output looks correct to me--there's nothing anomalous about the range, because the denominator includes both negative and positive numbers. That suggests it may contain numbers close to zero. Dividing by them will produce values of large size (potentially above 10^30), both positive and negative.
04-08-2011
08:00 AM
- Mark as New
- Bookmark
- Subscribe
- Mute
- Subscribe to RSS Feed
- Permalink
have your ruled this out as simply being a symbology issue? have you tried to float one of the rasters in the raster calculator prior to division to ensure floating point division? Have you investigated the histogram for the data?
Dan, thank-you for your input. Yes I have ruled out symbology and yes I have tried multiple float operations in the calculator (which yield the same results). The histogram is unfortunately based on the anomalous data. See photo of stats used for classification and histogram. Also, I have tried to recalculate statistics to no avail. Am I simply overlooking something simple? Any thoughts?
by
Anonymous User
Not applicable
04-08-2011
08:19 AM
- Mark as New
- Bookmark
- Subscribe
- Mute
- Subscribe to RSS Feed
- Permalink
Original User: pl1021
Hey Bill. Thanks. Am I wrong in assuming the ranges of dividing both rasters should calculate as following because those two cells are being divided?
For example the two maximum raster values:
51.86/38.263 = 1.355356
The output looks correct to me--there's nothing anomalous about the range, because the denominator includes both negative and positive numbers.
Hey Bill. Thanks. Am I wrong in assuming the ranges of dividing both rasters should calculate as following because those two cells are being divided?
For example the two maximum raster values:
51.86/38.263 = 1.355356
by
Anonymous User
Not applicable
04-09-2011
01:24 PM
- Mark as New
- Bookmark
- Subscribe
- Mute
- Subscribe to RSS Feed
- Permalink
Original User: whuber
To see that this is not correct, consider two two-cell grids. Grid contains (10,1)--in that order--and grid contains (10, .000001). The quotient of the two grids is...
Am I wrong in assuming the ranges of dividing both rasters should calculate as following because those two cells are being divided?
For example the two maximum raster values:
51.86/38.263 = 1.355356
To see that this is not correct, consider two two-cell grids. Grid contains (10,1)--in that order--and grid contains (10, .000001). The quotient of the two grids is...