Turn on suggestions
Auto-suggest helps you quickly narrow down your search results by suggesting possible matches as you type.
Cancel
- Home
- :
- All Communities
- :
- Products
- :
- ArcGIS Spatial Analyst
- :
- ArcGIS Spatial Analyst Questions
- :
- Re: How to symbolize polygons in time-enabled maps
Options
- Subscribe to RSS Feed
- Mark Topic as New
- Mark Topic as Read
- Float this Topic for Current User
- Bookmark
- Subscribe
- Mute
- Printer Friendly Page
How to symbolize polygons in time-enabled maps
Subscribe
2618
1
05-30-2011 04:33 PM
05-30-2011
04:33 PM
- Mark as New
- Bookmark
- Subscribe
- Mute
- Subscribe to RSS Feed
- Permalink
Hello,
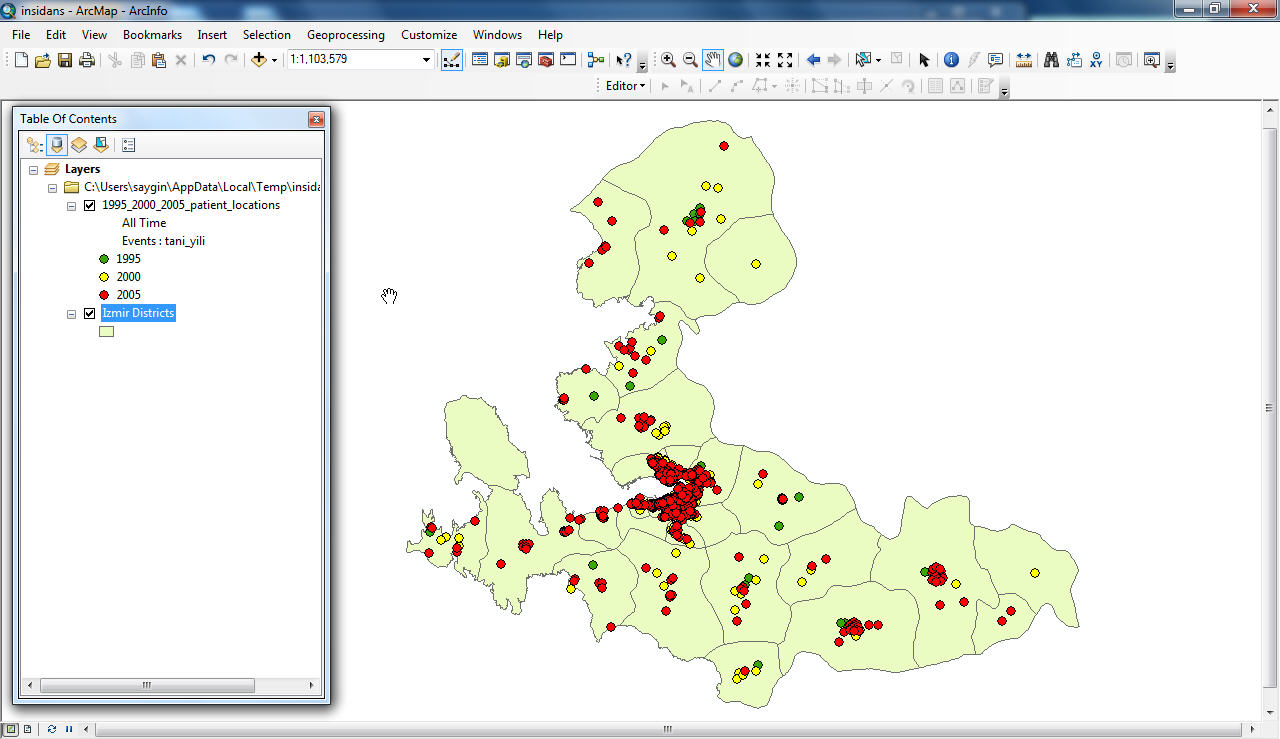
My apologies for cross-posting, I have a quick question which I've been trying to find a working solution for weeks. I'm trying to investigate the spatial distribution of cancer data within a province for year 1995, 2000 and 2005. I have exact locations of each cancer patient (without any personal private information) in districts as a point feature class for each year. When I enable the time in
point layer, I can easily see the the change between years just using the slider. But what I'm trying to do is that to change the symbol of districts (polygons) instead of points. The sample screen-shot is attached.
Of course each polygon could only be spatially joined to one point. I believe the solution could also applies to Tracking Analyst Extension. Thank you for sharing your experience and suggestions in advance.
Kind Regards
Omur Saygin, Ph.D.
1 Reply
12-11-2012
05:43 AM
- Mark as New
- Bookmark
- Subscribe
- Mute
- Subscribe to RSS Feed
- Permalink
Hello,
I know this is much later than your original post, but I have an answer for anyone else who is wondering how to do this. I had a similar set up (mine was trees points in neighborhoods) and I wanted a polygon representation of growth of our program over time. I performed a spatial join (polygons to points) and chose to summarize the attributes by Minimum. In the resulting table, the minimum year of a point inside that polygon was recorded in MIN_YEAR and associated with the appropriate neighborhood. I then enabled time on that new layer using the time slider button and assigned MIN_YEAR as the date field and set the other preference accordingly. This method doesn't relfect any sort of concentration over time, but it does give you a nice overview of simple growth over time.
Hope that helps!