- Home
- :
- All Communities
- :
- Products
- :
- ArcGIS Spatial Analyst
- :
- ArcGIS Spatial Analyst Questions
- :
- Re: How does the Rescale by Function tool work?
- Subscribe to RSS Feed
- Mark Topic as New
- Mark Topic as Read
- Float this Topic for Current User
- Bookmark
- Subscribe
- Mute
- Printer Friendly Page
- Mark as New
- Bookmark
- Subscribe
- Mute
- Subscribe to RSS Feed
- Permalink
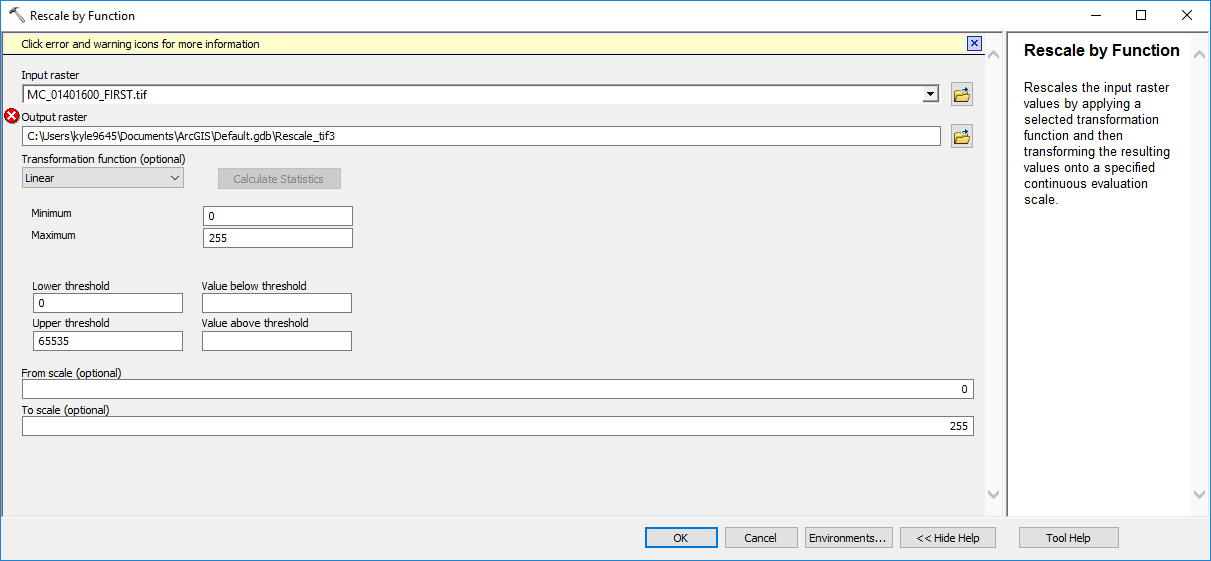
I am trying to fit all of my pixel values on my raster in between 0 and 255. Currently, they range from 0 to 65535. I wanted to use the Rescale by Function tool with the TfLinear to scale it, but when I put the output on a map I only see 0 values.
Here are the parameters I used:
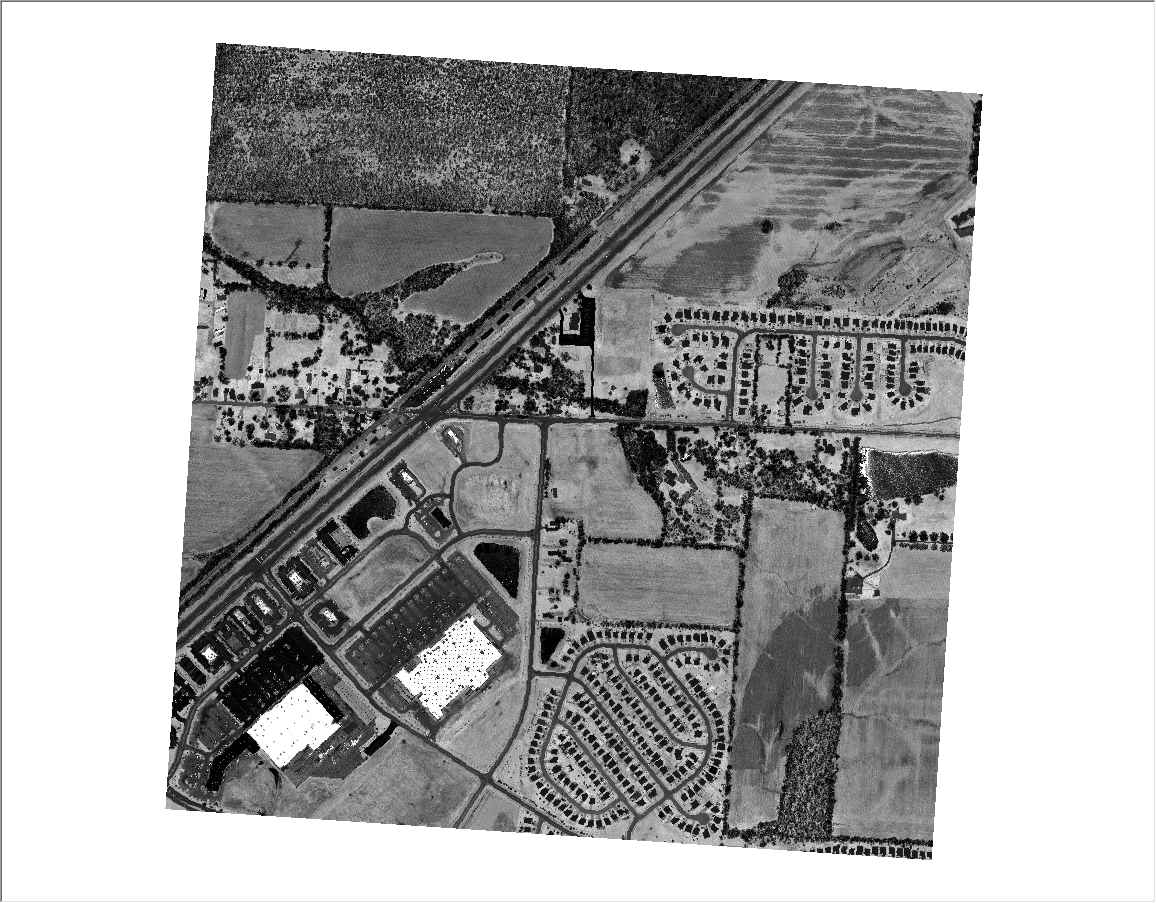
Here is the original raster:
Here is the output of the tool:
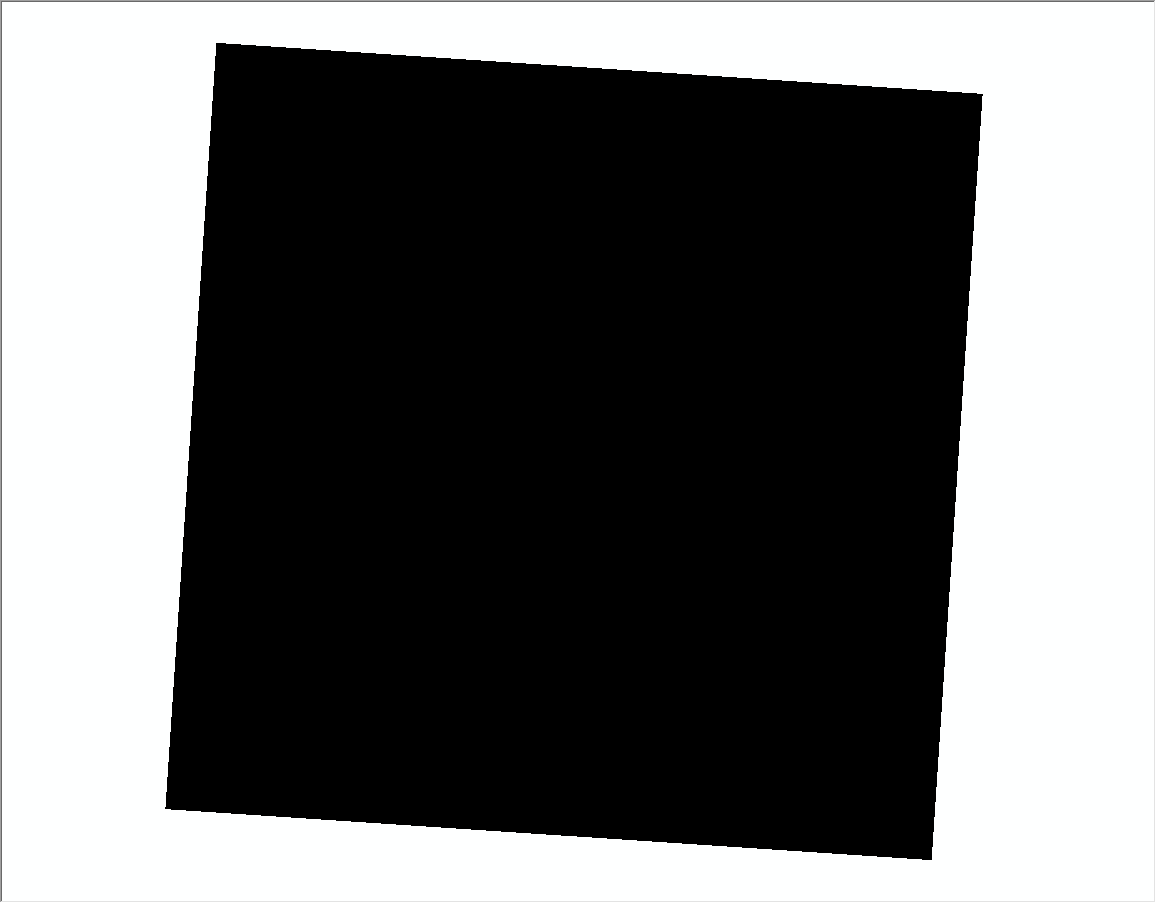
Am I doing anything wrong?
Solved! Go to Solution.
Accepted Solutions
- Mark as New
- Bookmark
- Subscribe
- Mute
- Subscribe to RSS Feed
- Permalink
I just talked to Kevin Johnston.
The problem was by setting the Maximum to 255 for the parameter defining the function, I was fitting the linear function only to 0 to 255 of the input values. I needed to fit the function to the full range of the dataset, therefore I have to specify the Maximum to be 65535. For the output scale, I keep what I have, 0 to 255. By using these parameters, I am fitting the function to the full range of the input values of the dataset and linearly transforming to the 0 to 255 scale.
I just tried it and worked as I hoped.
- Mark as New
- Bookmark
- Subscribe
- Mute
- Subscribe to RSS Feed
- Permalink
Hi Kyle,
We need to understand if the output from the tool is wrong or having display problem.
Can you please check the statistics of the RescaleByFunction output from layer property?
Are you using ArcGIS Pro or in ArcMap?
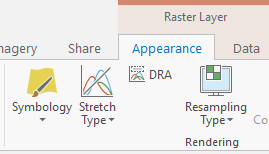
If in Pro, if the statistics looks good, can you please click on the DRA on the Raster Layer/Appearance ribbon to see if it improves your display?
Thanks,
Noman
Esri, Redlands, CA.
- Mark as New
- Bookmark
- Subscribe
- Mute
- Subscribe to RSS Feed
- Permalink
Hi Noman,
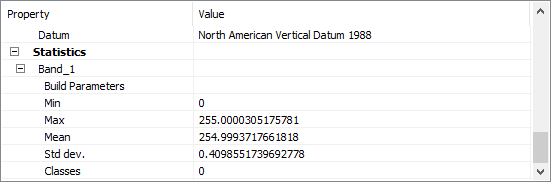
Thanks for the reply! I'm using ArcMap. I did check the statistics and it looks incorrect to me. It appears as though the average is 255 (or close enough 254.999).
Best,
Kyle
- Mark as New
- Bookmark
- Subscribe
- Mute
- Subscribe to RSS Feed
- Permalink
what does a histogram of the data look like? Does 65535 represent nodata? and what is the upper limit excluding that value? I am guessing there is a large gap.
- Mark as New
- Bookmark
- Subscribe
- Mute
- Subscribe to RSS Feed
- Permalink
Hi Kyle,
Thanks for your reply.
What is the version of the ArcGIS are you using?
Is it possible to share your data with me?
Can you post the statistics and histogram of your input data? And your input data type (integer, float, double) as well?
What is the format of your input and output raster dataset?
I am sorry if the tool is creating incorrect output. Hopefully we will get to the bottom of this problem.
Thanks
Noman
- Mark as New
- Bookmark
- Subscribe
- Mute
- Subscribe to RSS Feed
- Permalink
I just talked to Kevin Johnston.
The problem was by setting the Maximum to 255 for the parameter defining the function, I was fitting the linear function only to 0 to 255 of the input values. I needed to fit the function to the full range of the dataset, therefore I have to specify the Maximum to be 65535. For the output scale, I keep what I have, 0 to 255. By using these parameters, I am fitting the function to the full range of the input values of the dataset and linearly transforming to the 0 to 255 scale.
I just tried it and worked as I hoped.