- Home
- :
- All Communities
- :
- Products
- :
- ArcGIS Spatial Analyst
- :
- ArcGIS Spatial Analyst Questions
- :
- Create multiple interpolations from different rows
- Subscribe to RSS Feed
- Mark Topic as New
- Mark Topic as Read
- Float this Topic for Current User
- Bookmark
- Subscribe
- Mute
- Printer Friendly Page
Create multiple interpolations from different rows
- Mark as New
- Bookmark
- Subscribe
- Mute
- Subscribe to RSS Feed
- Permalink
Hello everybody,
i have daily soil moisture measurements from several nodes in different locations for a monitoring period of ~14 months. I would like to create interpolations from the measurements for each day and then show how they change over time with the time slider tool.
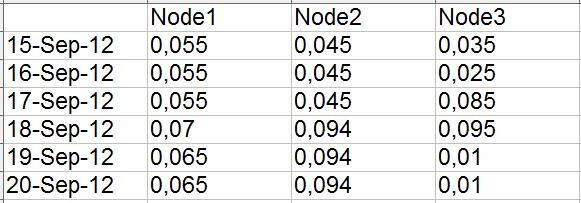
Here's a small sample from the data:

So in this case i would like to interpolate the values of node1,2&3 for September 15th, then create another interpolation with the node values for September 16th, then another interpolation for September 17th and so on. So as a result i want to have an interpolation-layer for each day and then compare how they change over time using the time slider tool. My goal is to find soil moisture patterns to infer the hydrological processes in the study site.
My problem is that it would take too much time to interpolate each day of the monitoring period (430 days) by hand.
Is there a quicker way to do this? I thought about using the model builder but i don't know how. The model would have to interpolate the data from row A (day 1) , add the interpolated layer to the map, and then move to row B (day 2) where it does the same procedure and so on.
Best regards,
Philip