- Home
- :
- All Communities
- :
- Products
- :
- ArcGIS Spatial Analyst
- :
- ArcGIS Spatial Analyst Questions
- :
- Aggregate raster to another layer
- Subscribe to RSS Feed
- Mark Topic as New
- Mark Topic as Read
- Float this Topic for Current User
- Bookmark
- Subscribe
- Mute
- Printer Friendly Page
Aggregate raster to another layer
- Mark as New
- Bookmark
- Subscribe
- Mute
- Subscribe to RSS Feed
- Permalink
Hi all,
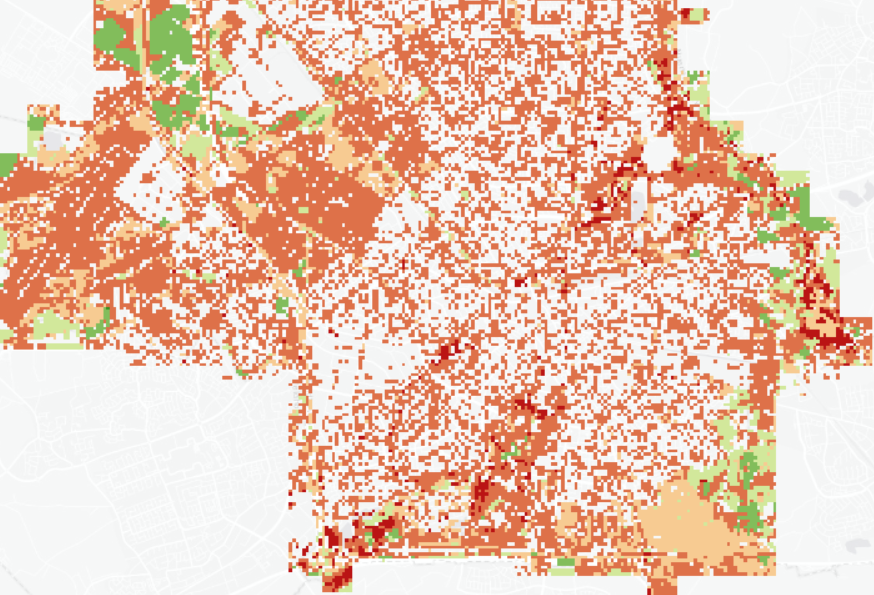
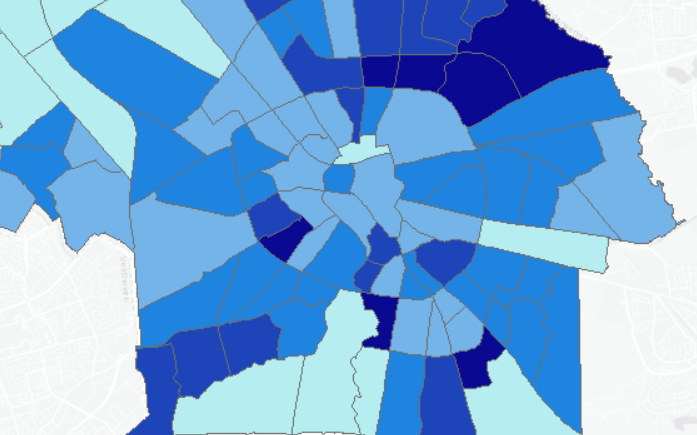
I have created a raster dataset which I want to aggregrate to another layer I have. This layer has borders of neighbourhoods and I want to map the average of each neighboorheid in my raster.
My raster looks like this;
And I want my output to look like this;

Do you guys have some tips for me?
I am fairly new when it comes to arcmap so any tips are welcome!
Cheers,
Kevin
- Mark as New
- Bookmark
- Subscribe
- Mute
- Subscribe to RSS Feed
- Permalink
I you have access to Spatial Analyst, the first thing that come into mind would be using Zonal Statistics—Help | ArcGIS Desktop . What do the colors in your map represent? I see blue, 2 tones of orange and red. Are these somehow numeric values? In that case Zonal Statistics would be the tool to use. In case that is categorical data like land use or something similar, you should use Tabulate Area—Help | ArcGIS Desktop in order to get information about each land use in each neighborhood.
- Mark as New
- Bookmark
- Subscribe
- Mute
- Subscribe to RSS Feed
- Permalink
Hi Xander,
Thank you for your answer.
The colors represent a combination I created in a weighted overview of landuse (vegetation and roads) and groundwater. I will test out both tools and check the results.