- Home
- :
- All Communities
- :
- Developers
- :
- ArcGIS Pro SDK
- :
- ArcGIS Pro SDK Questions
- :
- Managed Debugging Assistant 'DisconnectedContext'
- Subscribe to RSS Feed
- Mark Topic as New
- Mark Topic as Read
- Float this Topic for Current User
- Bookmark
- Subscribe
- Mute
- Printer Friendly Page
Managed Debugging Assistant 'DisconnectedContext'
- Mark as New
- Bookmark
- Subscribe
- Mute
- Subscribe to RSS Feed
- Permalink
Hi All,
Once I closed the ArcGIS Pro (version 2.8) - getting below error message.
Managed Debugging Assistant 'DisconnectedContext' : 'Transition into COM context 0xdaa009c0 for this RuntimeCallableWrapper failed with the following error: The object invoked has disconnected from its clients. (Exception from HRESULT: 0x80010108 (RPC_E_DISCONNECTED)). This is typically because the COM context 0xdaa009c0 where this RuntimeCallableWrapper was created has been disconnected or it is busy doing something else. Releasing the interfaces from the current COM context (COM context 0xdaa002d0). This may cause corruption or data loss. To avoid this problem, please ensure that all COM contexts/apartments/threads stay alive and are available for context transition, until the application is completely done with the RuntimeCallableWrappers that represents COM components that live inside them.'
I have cross-checked my code and there are no threads created without await and we are coming out from the process after completion of these await statement.
For ex,
await QueuedTask.Run(() => { activateSelectToolAsync(); });
return false;
Is there any way - we can see which process is creating issue? Appreciate your help on this.
Solved! Go to Solution.
Accepted Solutions
- Mark as New
- Bookmark
- Subscribe
- Mute
- Subscribe to RSS Feed
- Permalink
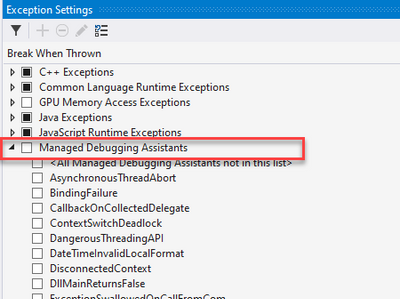
This has been a known issue we first noticed in 2019 with the release of Visual Studio 2019, and it can occur randomly even throughout a debug session. The ArcGIS Pro development team looked into it and deemed it benign. The recommendation to work around this issue is the following:
What you are seeing is one of "Managed Debugging Assistants" (MDA) and can be disabled by Debug->Exceptions ... > Expand the MDA node and uncheck the box against contextswitchdeadlock .
Note: I usually turn off all 'MDA's as they are not relevant for debugging my add-ins.
- Mark as New
- Bookmark
- Subscribe
- Mute
- Subscribe to RSS Feed
- Permalink
Thank you Wolf.
