- Home
- :
- All Communities
- :
- Products
- :
- ArcGIS Pro
- :
- ArcGIS Pro Questions
- :
- Re: Thinning points based on a time interval
- Subscribe to RSS Feed
- Mark Topic as New
- Mark Topic as Read
- Float this Topic for Current User
- Bookmark
- Subscribe
- Mute
- Printer Friendly Page
- Mark as New
- Bookmark
- Subscribe
- Mute
- Subscribe to RSS Feed
- Permalink
Not sure of the etiquette here, but I am reposting this question on the ArcGIS Pro feed, as I didn't get any responses under the ArcMap heading.
************
Hi-- I want to reduce the number of points in vessel tracklines based on a time interval from a datetimestamp value. I can reduce the number of points based on distance using the 'Delete Identical' tool, but I'd like to be able to reduce the number of points by selecting points based on a user defined interval, like a two or five minute interval, and culling the extraneous points. I have not found any obvious way to do this with the built in tools in ArcMap or Pro, but I'm hoping someone else has worked through this and can suggest a workflow or solution. I am still more comfortable working in ArcMap, but can work in Pro if the solution lies there.
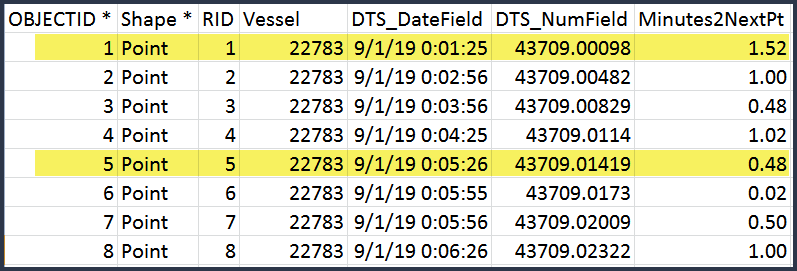
Here is simplified version of what the tabular data look like. The highlighted rows show what records would be selected if I chose four minute interval. It makes sense that some rounding of the times may be needed to standardize the time breaks.
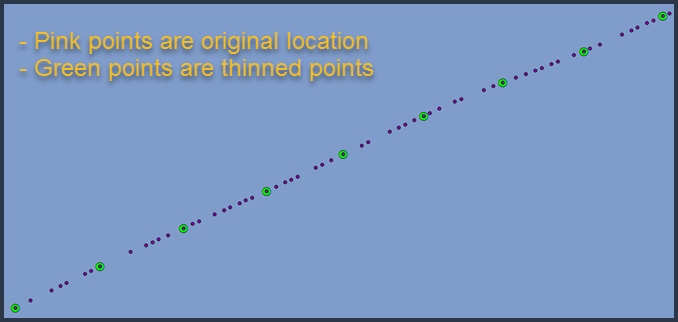
Here is what the desired output might look like.
Thanks!
Solved! Go to Solution.
- Mark as New
- Bookmark
- Subscribe
- Mute
- Subscribe to RSS Feed
- Permalink
I somehow stumbled on this post from late last year. I thought I should provide another solution to this problem for folks from the future 🙂
- Pros: the benefit of this approach is that this dynamic. When new data comes in, it will continue to work without you doing anything.
- Cons: you must use enterprise database. FileGDB won't work.
- finally the sql that I provided below is not a very elegant one. I put that together quickly and also helps you understand what is going on in this nested fashion.
Let's take a look at the output first:
Black dots represents the original vessel's positions in the screenshot below. Red circles, off a different layer, show positions with some temporal gaps. Imagine you group the original locations (black dots) into bins/buckets of 5 min interval. Then pick up first ones (red circles) from each group. That is what I did here.

How to:
- first you must copy data in an enterprise database (in my case I copied them in a SQL Server)
i used the data attached in the previous comment - click Query Layer from Add Data dropdown in Map tab in ArcGIS Pro
- choose your database connection
- provide a name
- paste the following SQL (this is for SQL Server, and should work with other database flavors too)
select objectid, datetimestamp, mmsi, latitude, longitude, shape from
(
select *, rank() over (partition by elapsed_time_group order by datetimestamp) as rnk
from
(
select *,
DATEDIFF(second, FIRST_VALUE(datetimestamp) over(order by datetimestamp), datetimestamp) / 300 as elapsed_time_group
from VESSELTRACK_MMSIPOINTS
) a
) b where b.rnk = 1- click Validate
- click Next
- make sure the correct field is chosen as the Unique Identifier Fields(s) aka the object-id field
- make sure the Geometry type and spatial reference is picked correctly. Otherwise choose one.
- click Finish
- a query layer gets added to your map
Problem with this SQL is that it produces a result where a few positions are still very close together (see the screenshots below). That is because positions are not recorded at a regular frequency.

To weed out those points too, I have added an additional filter in the SQL - see below.
select objectid, datetimestamp, mmsi, latitude, longitude, shape
from
(
	select *, datediff(minute, lag(datetimestamp) over (order by datetimestamp), datetimestamp) as time_diff
	from
	(
		select objectid, datetimestamp, mmsi, latitude, longitude, shape from
		(
			select *, rank() over (partition by elapsed_time_group order by datetimestamp) as rnk
			from
			(
				select *,
					DATEDIFF(second, FIRST_VALUE(datetimestamp) over(order by datetimestamp), datetimestamp) / 300 as elapsed_time_group
				from VESSELTRACK_MMSIPOINTS
			) a
		) b where b.rnk = 1
	) c
) d
where d.time_diff > 2 or d.time_diff is null
here is the output where green circles represents a cleaner version of the previous one.

Hope some folks might find this helpful in the future 🙂
- « Previous
-
- 1
- 2
- Next »
- « Previous
-
- 1
- 2
- Next »