- Home
- :
- All Communities
- :
- Products
- :
- ArcGIS Pro
- :
- ArcGIS Pro Questions
- :
- Re: Symbolize by mean (Arcade)
- Subscribe to RSS Feed
- Mark Topic as New
- Mark Topic as Read
- Float this Topic for Current User
- Bookmark
- Subscribe
- Mute
- Printer Friendly Page
Symbolize by mean (Arcade)
- Mark as New
- Bookmark
- Subscribe
- Mute
- Subscribe to RSS Feed
- Permalink
In https://community.esri.com/message/860558-mean-for-all-features-not-just-one-arcade I was able to figure out how to set up a pop up to display the mean() of all the features in a given feature layer. However, now I'm faced with the same requirement but for symbology.
As in the earlier post, I have the same polygon feature class of zipcodes, that represent monthly deliveries; for a given zipcode, there are twelve polygon features 'stacked' on top of each other, the result of monthly geoprocessing and appended to the zipcode polygon feature class.
- Mark as New
- Bookmark
- Subscribe
- Mute
- Subscribe to RSS Feed
- Permalink
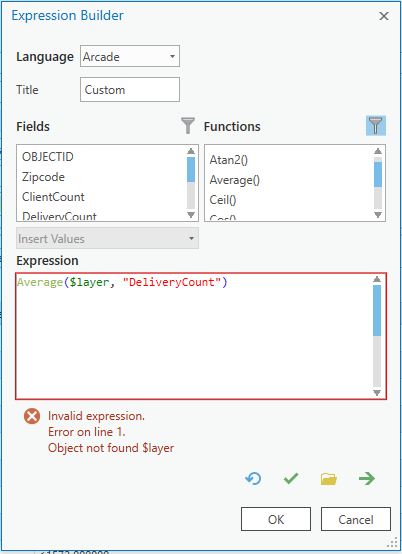
Options are rather limited in the symbology profile with Arcade in order no to affect the performance in drawing the layer. Options like $map, $layer and FeatureSetBy* functions are not available. If the data is static you can perform a field calculation using Arcade to calulate the mean. However, if the data is dynamic this might not be your best option.
- Mark as New
- Bookmark
- Subscribe
- Mute
- Subscribe to RSS Feed
- Permalink
I wasn't sure of why, but some where in the help docs, it alludes to those as not being available. I have a mix of static and dynamic data: the 2018 data is static while the 2019 data will be dynamic till January 2020, and so on....
- Mark as New
- Bookmark
- Subscribe
- Mute
- Subscribe to RSS Feed
- Permalink
So the field calculation could be something like this (for the static data or you would have to repeat the calculation each month as new data comes in).
var zipcode = $feature.zipcode;
var sql = "zipcode = '" + zipcode + "'";
var zipcode_layer = FeatureSetByName($datastore, "Name of your zipcode layer in the datastore", ["zipcode", "DeliveryCount"], False);
var zipcode_features = Filter(zipcode_layer, sql);
return Average(zipcode_features, "DeliveryCount");
Another reason of not doing this dynamically in the symbology profile is the fact that it will draw 12 polygons (for 1 year) on top of each other and it will have to do the same calculation for each polygon, when only one will be visible.
- Mark as New
- Bookmark
- Subscribe
- Mute
- Subscribe to RSS Feed
- Permalink
The monthly data gets processed via Python as a scheduled taks; I could add an actual field to the data structure in the python code and re-calc it as part of that process. Just another couple lines of code, but lately I've had this thing about not adding fields per se....