- Home
- :
- All Communities
- :
- Products
- :
- ArcGIS Pro
- :
- ArcGIS Pro Questions
- :
- Retaining statistics while using Dynamic Range Adj...
- Subscribe to RSS Feed
- Mark Topic as New
- Mark Topic as Read
- Float this Topic for Current User
- Bookmark
- Subscribe
- Mute
- Printer Friendly Page
Retaining statistics while using Dynamic Range Adjustment (DRA) in Symbology for Rasters
- Mark as New
- Bookmark
- Subscribe
- Mute
- Subscribe to RSS Feed
- Permalink
Arc Pro 2.0.1
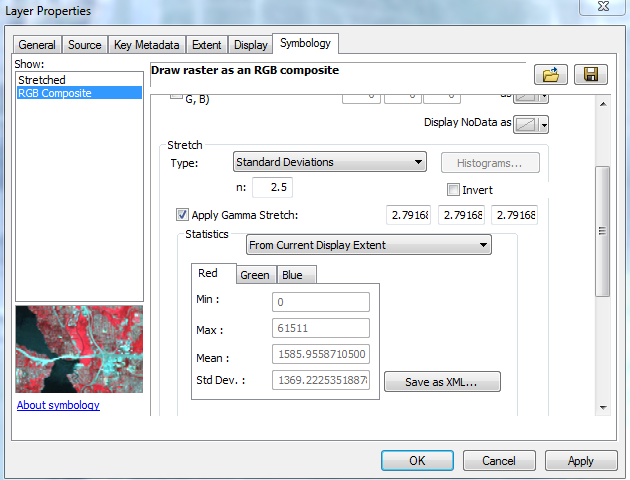
I am trying to retain the DRA statistics within the symbology for my selected layer/raster. The goal is to use these statistics and apply them to my raster and have a specific stretch for the whole image.
Coming from arc desktop where a step in the symbology allowed to calculate the current display extents statistics and then apply these (using "from custom settings below"). These statistics were then retained in the image until changed at a later date.
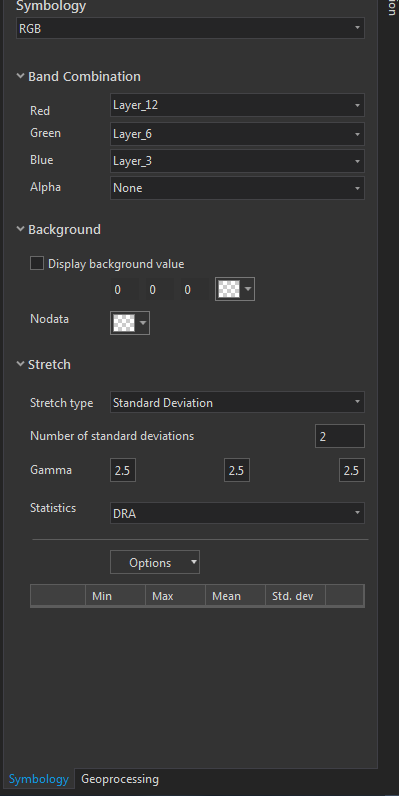
When I try the same process on arc pro the statistics do not appear to calculate.
There is an option for custom statistics however I wouldn't know what these are without them being displayed to me.
Has anyone else come across this problem before ? If so is there a way around this using pro ? I can go to desktop and zoom to the same area, then save the stats to a .xml file and load this up in pro - however I feel as though there must be an easier and more direct way ...
- Mark as New
- Bookmark
- Subscribe
- Mute
- Subscribe to RSS Feed
- Permalink
This is maddening and very confusing. Not only is there no way to know what the dynamically calculated statistics are, the Table of Contents / Legend isn't updated either. This results in some very confused folks.
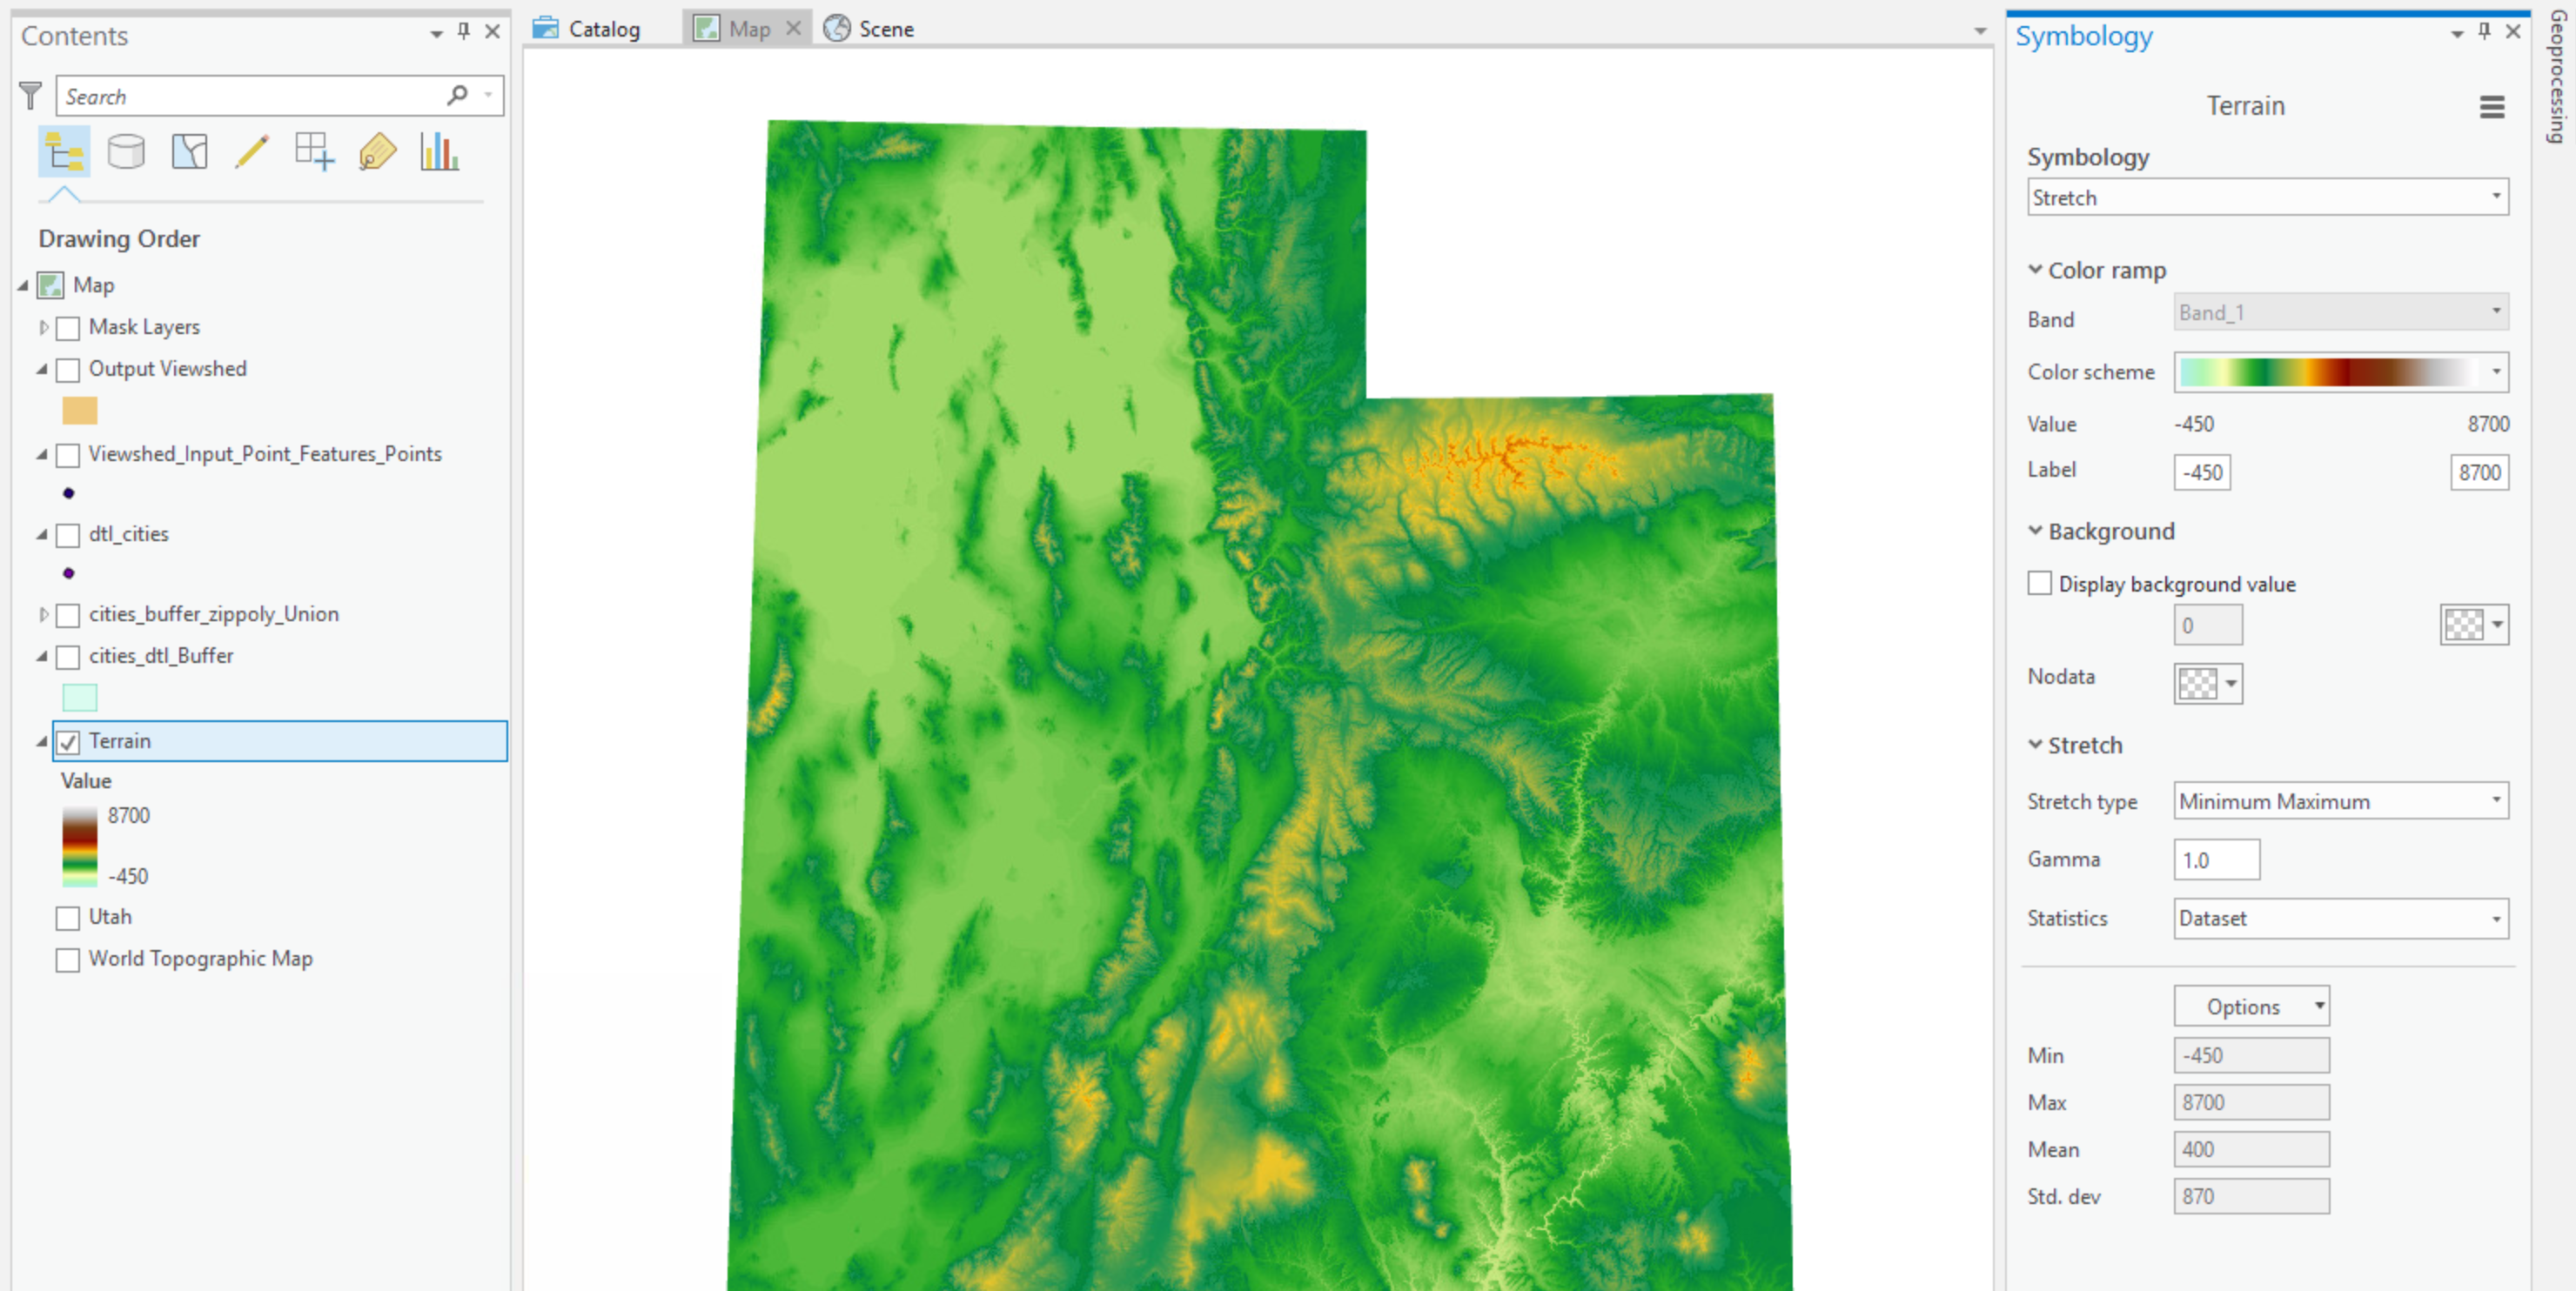
Using the Esri Terrain multi-resolution elevation layer, the default is a min-max stretch using the dataset's min of -450 meters to the max of 8700 meters.
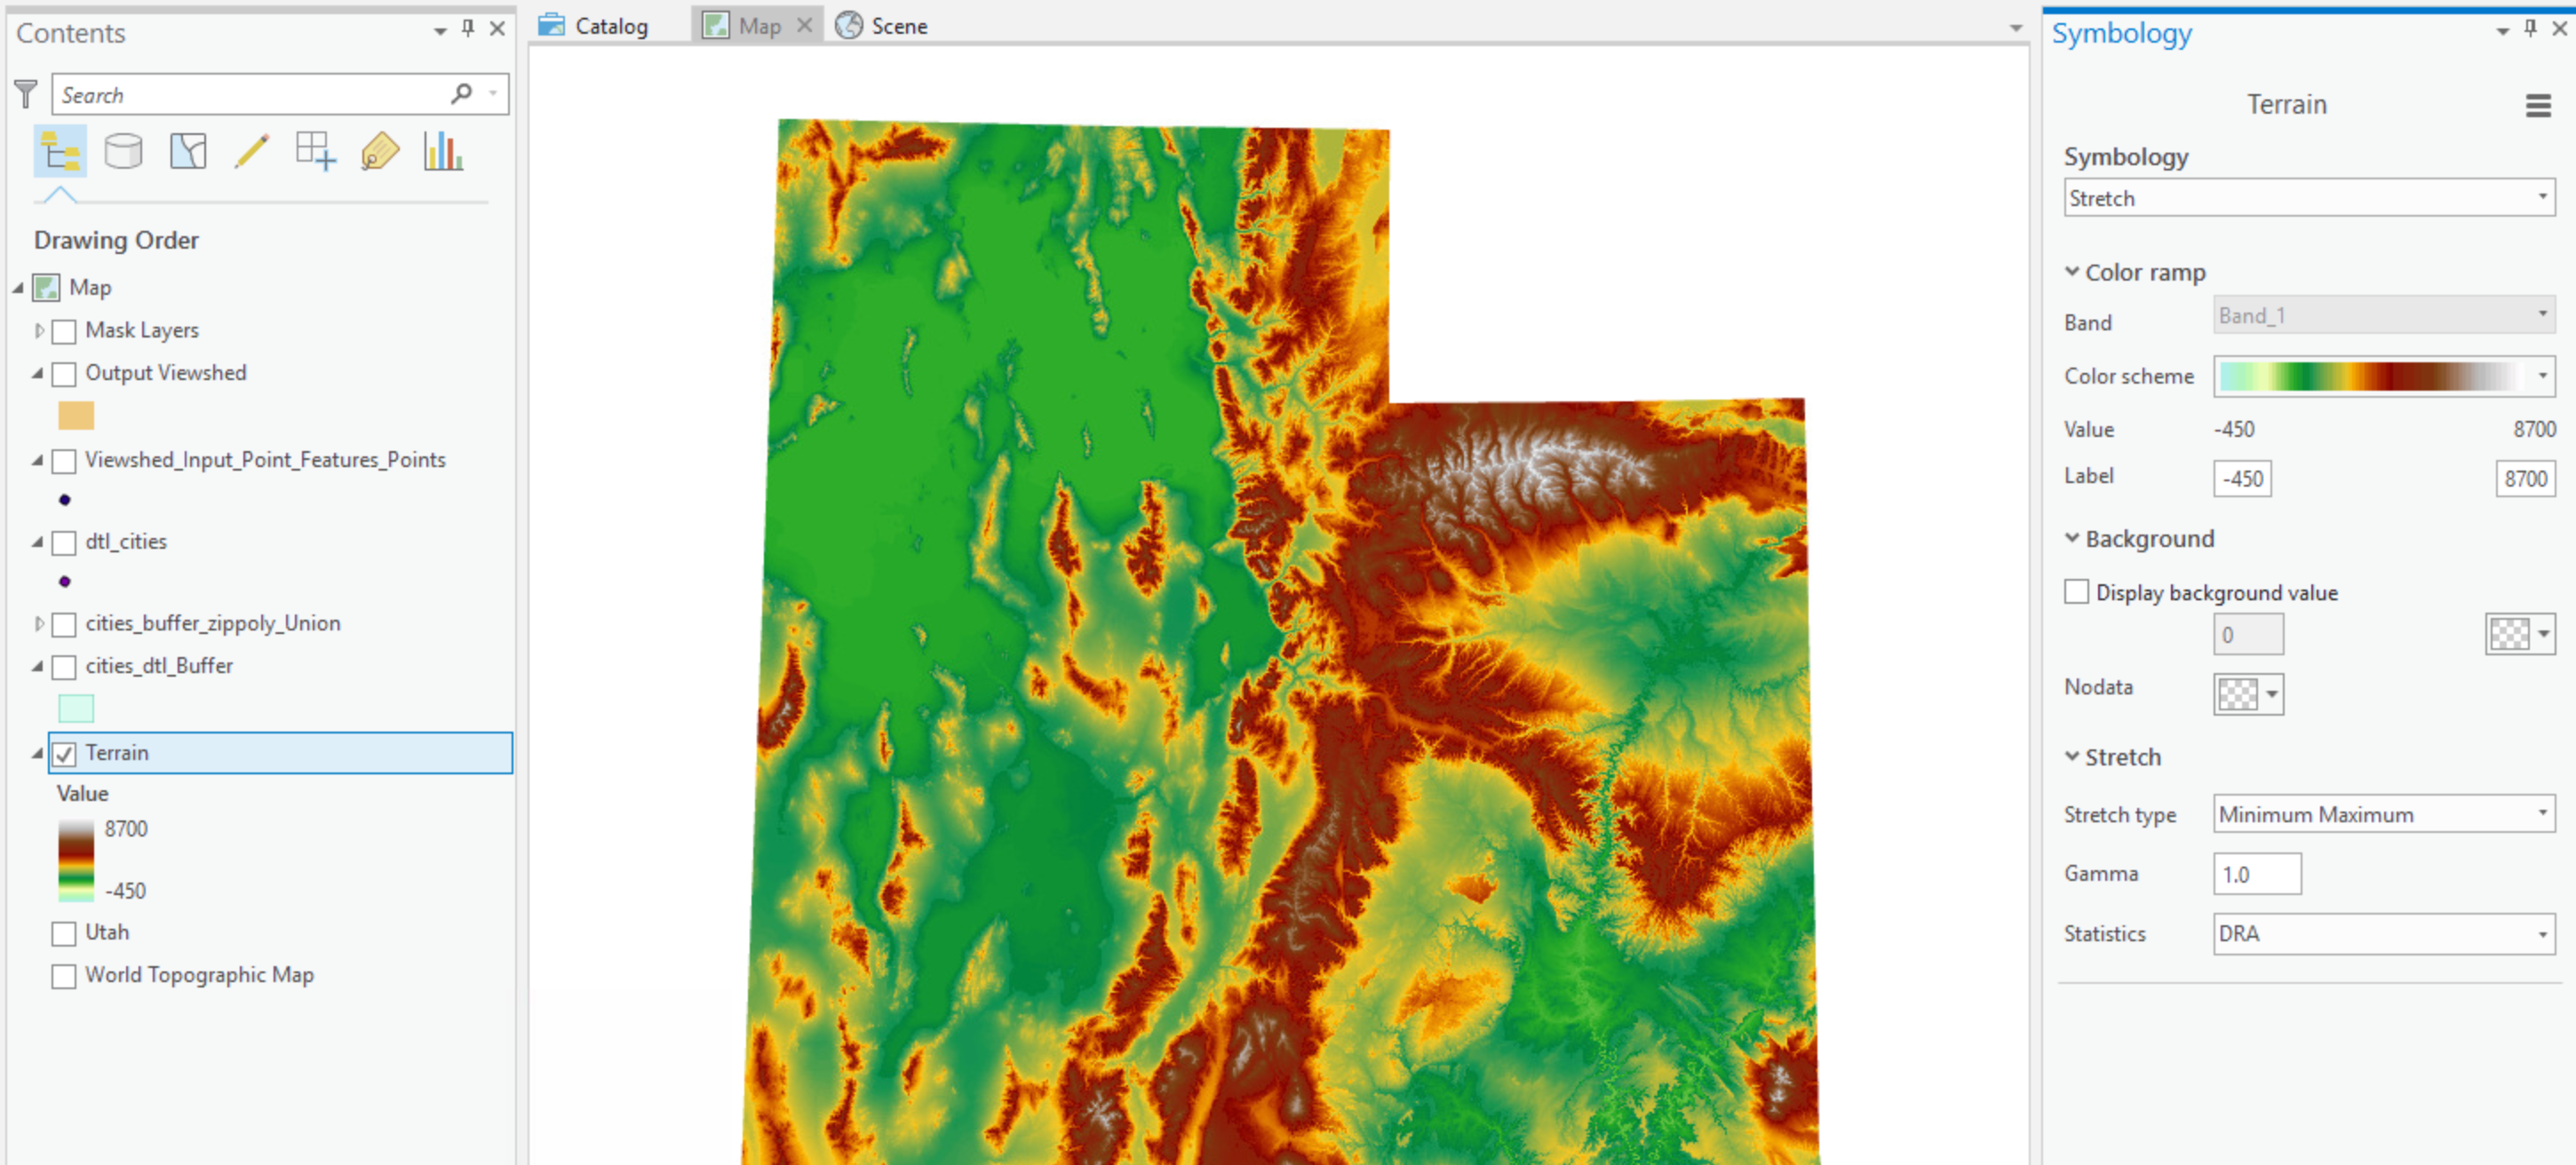
If I turn on DRA, I get the following image, which differentiates between mountains and valleys and everything in between much better. However, I have no idea what the min-max is, and the colors no longer match the Table of Contents (or legend if published to AGO). It still says -450 to 8700. So are those mountains near the Wyoming border (upper right) approaching 8700 meters?!
If you think Custom, think again. It still doesn't change, no matter how crazy you get (if you can't tell, I made up some numbers). Based on the Table of Contents, it appears that the entirety of Utah is above 20,000 feet or so.

I know what you're thinking - "Just change the labels you dummy!" Okay - what do I change them to? Now Utah is close to 2 million meters in elevation? There's no way to change the labels to appropriate values, because there is NO way to know what values ArcGIS is using unless you are using Min-Max for the entire dataset.

I'm using ArcGIS Pro 2.1.0
- Mark as New
- Bookmark
- Subscribe
- Mute
- Subscribe to RSS Feed
- Permalink
hi
I have the same problem. Esp. problematic when displaying satellite imagery that contain clouds etc.
I asked ESRI in the Imagery MOOC and Cartographic MOOC but did not get any answer from them (need to ask Developer team was the reply). Its maddening, and ESRI should be able to fix this as it cant be too difficult to save the stats from one view extend and apply it to the image (as in ArcMap).
The only workaround for me (in the case of satellite imagery) is to export the image as an RGB from ArcMap and use this in ArcGIS pro.. which defeats the purpose of using ArcGIS pro as a more efficient GIS platform.
- Mark as New
- Bookmark
- Subscribe
- Mute
- Subscribe to RSS Feed
- Permalink
same problem here!!!
- Mark as New
- Bookmark
- Subscribe
- Mute
- Subscribe to RSS Feed
- Permalink
See this blog to access a custom temporal solution