- Home
- :
- All Communities
- :
- Products
- :
- ArcGIS Pro
- :
- ArcGIS Pro Questions
- :
- "Failed to display the raster layer as Classify" i...
- Subscribe to RSS Feed
- Mark Topic as New
- Mark Topic as Read
- Float this Topic for Current User
- Bookmark
- Subscribe
- Mute
- Printer Friendly Page
"Failed to display the raster layer as Classify" in Arcpro 2.3.1, but works in ArcMap
- Mark as New
- Bookmark
- Subscribe
- Mute
- Subscribe to RSS Feed
- Permalink
Hi,
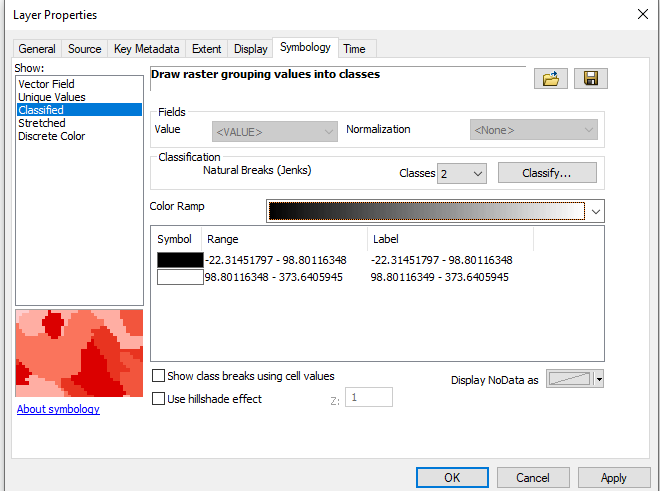
I am trying to symbolize a USGS DEM elevation raster into 2 classes: Values above 100 and values below 100.
In ArcMap, I have no trouble doing this. I open the raster properties and click "Classified". I answer "yes" to the question about computing a histogram:
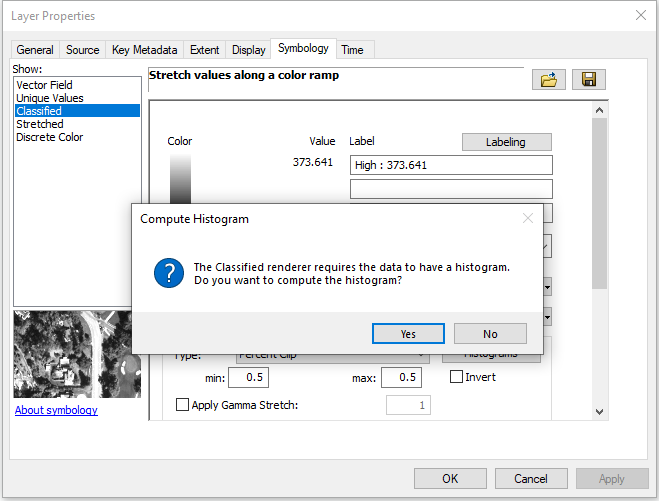
No problem there.
However if I try to do this in ArcPro 2.3.1 on the same exact raster, it won't work
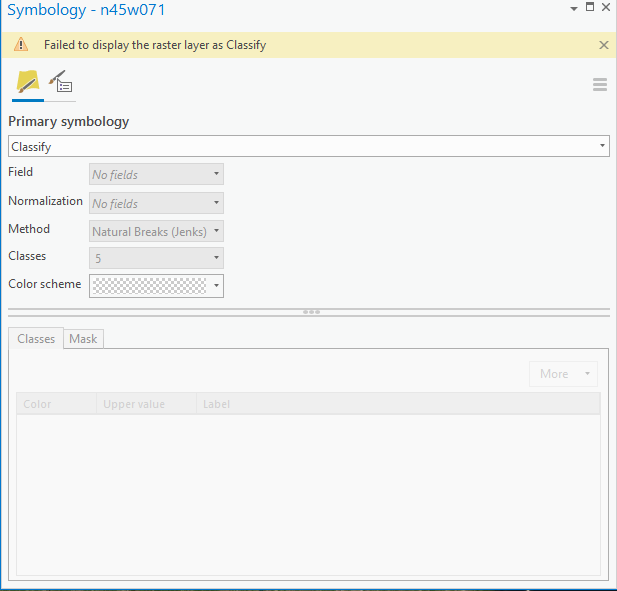
What am I doing wrong?
Thank you for the help!
- Mark as New
- Bookmark
- Subscribe
- Mute
- Subscribe to RSS Feed
- Permalink
Hi Molly,
Try this:
- Remove the raster from the map
- Right-click on the raster in the Catalog window
- Select Calculate Statistics
- Re-add the raster to map; will it let you classify the raster now?
I'm hoping so!
-Lauren
- Mark as New
- Bookmark
- Subscribe
- Mute
- Subscribe to RSS Feed
- Permalink
yes! this worked. Thank you Lauren.
- Mark as New
- Bookmark
- Subscribe
- Mute
- Subscribe to RSS Feed
- Permalink
Hi Lauren,
What did the "Calculate Statistics" do to enable the raster to be classified?
- Mark as New
- Bookmark
- Subscribe
- Mute
- Subscribe to RSS Feed
- Permalink
Hi Wendy,
The histogram necessary for a Classified raster is produced by Calculating Statistics. I'm not sure why the statistics (and the histogram) weren't generating in ArcGIS Pro from the Symbology pane when prompted, but Calculate Statistics from the Catalog pane is always a good next step if that happens.
If you're interested in the wider scope of the question, raster statistics tell the program how to symbolize each cell. Minimum, maximum, mean, and standard deviation, etc, are necessary for stretch symbology and for classified symbology, since without them, it's not clear to program what each cell's value should look like.
If you'd like to read more, here's some of the documentation on raster statistics:
Raster data statistics—Help | ArcGIS Desktop (though this is ArcMap documentation, it's still applicable to ArcGIS Pro)
Raster statistics (Environment setting)—Geoprocessing | ArcGIS Desktop
Calculate Statistics—Data Management toolbox | ArcGIS Desktop
Happy rastering!
-Lauren
- Mark as New
- Bookmark
- Subscribe
- Mute
- Subscribe to RSS Feed
- Permalink
Thanks for the explanation Lauren! I'll check out those links as well 🙂
- Mark as New
- Bookmark
- Subscribe
- Mute
- Subscribe to RSS Feed
- Permalink
Hi Lauren,
I followed your instructions but notice that when the new raster is added, the raster now displays all is pixel values as either -2,47 - 2.47. The original dataset min-max range is 0 - 3,000.
- Mark as New
- Bookmark
- Subscribe
- Mute
- Subscribe to RSS Feed
- Permalink
I'm having the same issue when trying to classify the slope map from the living atlas in ArcGis Pro, but im not able to select "calculate statistics" for this layer. Any advice here?
Best,
Jack
- Mark as New
- Bookmark
- Subscribe
- Mute
- Subscribe to RSS Feed
- Permalink
Having the same issue. A couple months ago I could add the living atlas layer, change to classify and set my own parameters. Now, I just get that failure to display raster as classify message. Upgrading to pro has its advantages but there are still a lot of bugs in the system.
- Mark as New
- Bookmark
- Subscribe
- Mute
- Subscribe to RSS Feed
- Permalink
Hi Lauren,
1. I tried these steps to no avail. After deleting slope layer from display and calculating statistics in the catalogue pane, the slope layer reappears in the display in stretch symbology. While trying to change to classify symbology, a message appears that the layer has no histogram. I click 'YES' to create histogram, but the same message appears: "Failed to display the raster as classified". I tried this on 2 different computers, 2 different ArcGIS PRO applications, but still doesn't work.
2. Also, even when slope layer is generated in stretch, and although the layer appears in the 'Contents' pane, it is nowhere to be found on the map display. Same for any other raster analysis I've done (aspect, etc.)
Would appreciate some help:)
Thanks, David