- Home
- :
- All Communities
- :
- Products
- :
- ArcGIS Pro
- :
- ArcGIS Pro Questions
- :
- Join table to feature layer with multiple records ...
- Subscribe to RSS Feed
- Mark Topic as New
- Mark Topic as Read
- Float this Topic for Current User
- Bookmark
- Subscribe
- Mute
- Printer Friendly Page
Join table to feature layer with multiple records per feature
- Mark as New
- Bookmark
- Subscribe
- Mute
- Subscribe to RSS Feed
- Permalink
I am trying to visualise temporal data following this tutorial (but using my own data). I have a standalone table with the data in at different times for each feature, in a similar fashion to below (ie multiple entries for the values for each building at different times).
| building | time | count |
|---|---|---|
| library | 22/11/2018 00:20:00 | 1 |
| house | 22/11/2018 00:20:00 | 2 |
| school | 22/11/2018 00:20:00 | 2 |
| library | 22/11/2018 00:40:00 | 3 |
| house | 22/11/2018 00:40:00 | 2 |
| school | 22/11/2018 00:40:00 | 4 |
| library | 22/11/2018 00:60:00 | 3 |
| house | 22/11/2018 00:60:00 | 5 |
| school | 22/11/2018 00:60:00 | 6 |
The standalone data table has 3,096 rows, showing the values for 43 buildings at 72 different times. The spatial data, to which I am trying to join the table, has 199 buildings (43 of which I have data for in the standalone table).
When I try to join the table to the layer, following the tutorial, the result only keeps the first instance of each building, ie the number of records in the layer's attribute table doesn't increase to include the values for each building at each point in time (as in the tutorial), but instead stays at 199 and only joins the values for the earliest time (thus making it impossible to visualise the data across time). Attached is a screenshot of the settings I have for the join – I've replicated those in the tutorial video but seem to have got a different result.
Where am I going wrong?
Solved! Go to Solution.
Accepted Solutions
- Mark as New
- Bookmark
- Subscribe
- Mute
- Subscribe to RSS Feed
- Permalink
For the future reference of anyone searching for the answer to the question I had, I managed to do what I wanted to and complete the tutorial by using the Make Query Table tool to query a table (which comes with the relevant polygons, ie isn't just a standalone table with the attribute information) which included all records where the join attributes match:

- Mark as New
- Bookmark
- Subscribe
- Mute
- Subscribe to RSS Feed
- Permalink
I know this is long past, but for anyone else who finds this thread, I also had the same issue. I pulled in a U.S. Counties shapefile from Tiger/Line and then added a separate stand alone table from NHGIS that showed historical population data by county. I wanted to join these two tables, and, according to the tutorial, I should have been able to. When I validated the join operation it kept telling me that it was a one-to-one join, which of course was wrong. The key was to verify that both the shapefile and my table were in the SAME GEODATABASE. As soon as I saved them to the right place the join worked perfectly as a many-to-one join.
Hope this helps!
- Mark as New
- Bookmark
- Subscribe
- Mute
- Subscribe to RSS Feed
- Permalink
I think you might want a relate, since a join is for a one-to-one match
- Mark as New
- Bookmark
- Subscribe
- Mute
- Subscribe to RSS Feed
- Permalink
The tutorial seems fairly clear that it should be a join – that's what they do in the video, and the accompanying written tutorial says this:
There are 68 records in the Territorial Authorities table (the target table) and 1,344 records in the ChineseTourismTransposed table (the join table). Because one record in the target table will match many records in the join table—all records with the same territory name will match—the join is called a one-to-many join.
But I don't know why when they perform the join it accepts the one-to-many join, but when I try to replicate it I'm stuck with a one-to-one match.
- Mark as New
- Bookmark
- Subscribe
- Mute
- Subscribe to RSS Feed
- Permalink
The order of target vs join table dictates whether it will be one-one or one-many using a join. That seems to be the case for the tutorial, so check the order of inputs used in the join tool
- Mark as New
- Bookmark
- Subscribe
- Mute
- Subscribe to RSS Feed
- Permalink
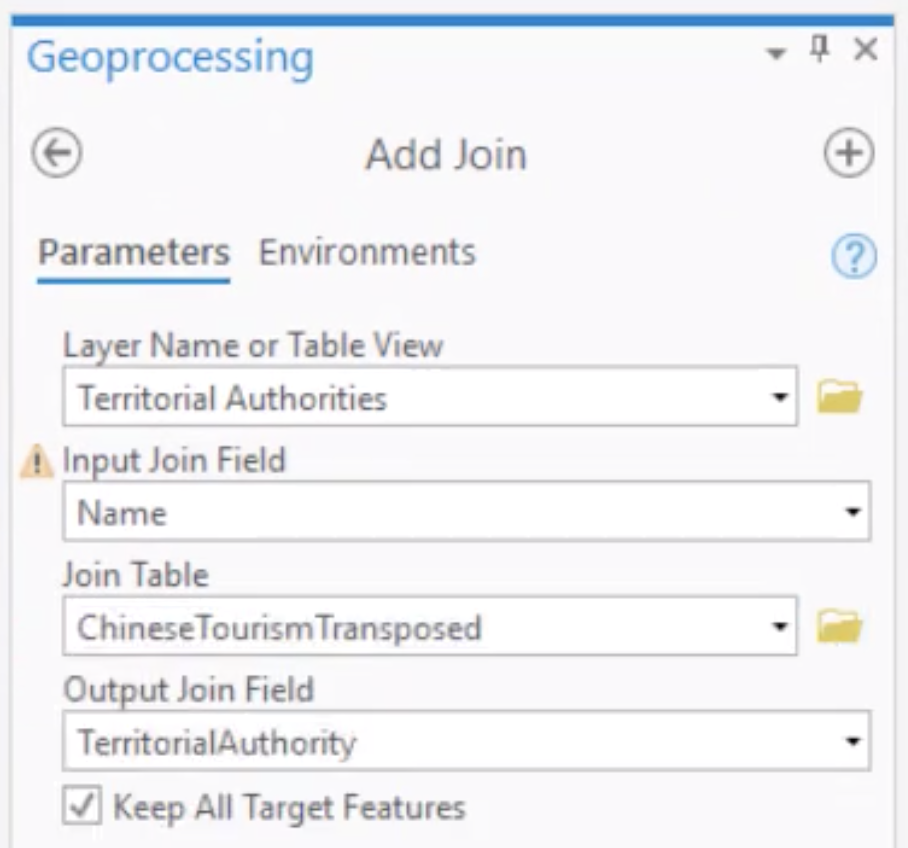
By 'target' do you mean the layer with features I am trying to join the table to? In the tutorial they right-click the layer then choose Add Join, and in the Add Join pane (screenshot below) the layer (the 'one' in the 'one-to-many' join) is given for 'Layer Name or Table View', and the table (the corresponding 'many') is given for 'Join Table'. In the tutorial this results in a one-to-many join, but when I have tried to replicate it with my own data I'm stuck with the one-to-one join that stops me from visualising the temporal data as in the tutorial.
- Mark as New
- Bookmark
- Subscribe
- Mute
- Subscribe to RSS Feed
- Permalink
With your own data... switch the order of the files in the dialog and see what happens. If it doesn't work the first way, the opposite way may
- Mark as New
- Bookmark
- Subscribe
- Mute
- Subscribe to RSS Feed
- Permalink
For the future reference of anyone searching for the answer to the question I had, I managed to do what I wanted to and complete the tutorial by using the Make Query Table tool to query a table (which comes with the relevant polygons, ie isn't just a standalone table with the attribute information) which included all records where the join attributes match:
- Mark as New
- Bookmark
- Subscribe
- Mute
- Subscribe to RSS Feed
- Permalink
Hi,
I tried your solution, but noticed that in "make query table", I cannot select a map layer together with a standalone table. Can I ask how did you make your standalone table work (I guess in your case it's "total")?
Thanks!
- Mark as New
- Bookmark
- Subscribe
- Mute
- Subscribe to RSS Feed
- Permalink
I know this is long past, but for anyone else who finds this thread, I also had the same issue. I pulled in a U.S. Counties shapefile from Tiger/Line and then added a separate stand alone table from NHGIS that showed historical population data by county. I wanted to join these two tables, and, according to the tutorial, I should have been able to. When I validated the join operation it kept telling me that it was a one-to-one join, which of course was wrong. The key was to verify that both the shapefile and my table were in the SAME GEODATABASE. As soon as I saved them to the right place the join worked perfectly as a many-to-one join.
Hope this helps!
- Mark as New
- Bookmark
- Subscribe
- Mute
- Subscribe to RSS Feed
- Permalink
Robyn, this was very helpful! After adding my polygon feature class to the same geodatabase as my table, the one-to-many join worked as expected.