- Home
- :
- All Communities
- :
- Products
- :
- ArcGIS Pro
- :
- ArcGIS Pro Questions
- :
- How do I create a 3D image from x,y,z coordinates?
- Subscribe to RSS Feed
- Mark Topic as New
- Mark Topic as Read
- Float this Topic for Current User
- Bookmark
- Subscribe
- Mute
- Printer Friendly Page
How do I create a 3D image from x,y,z coordinates?
- Mark as New
- Bookmark
- Subscribe
- Mute
- Subscribe to RSS Feed
- Permalink
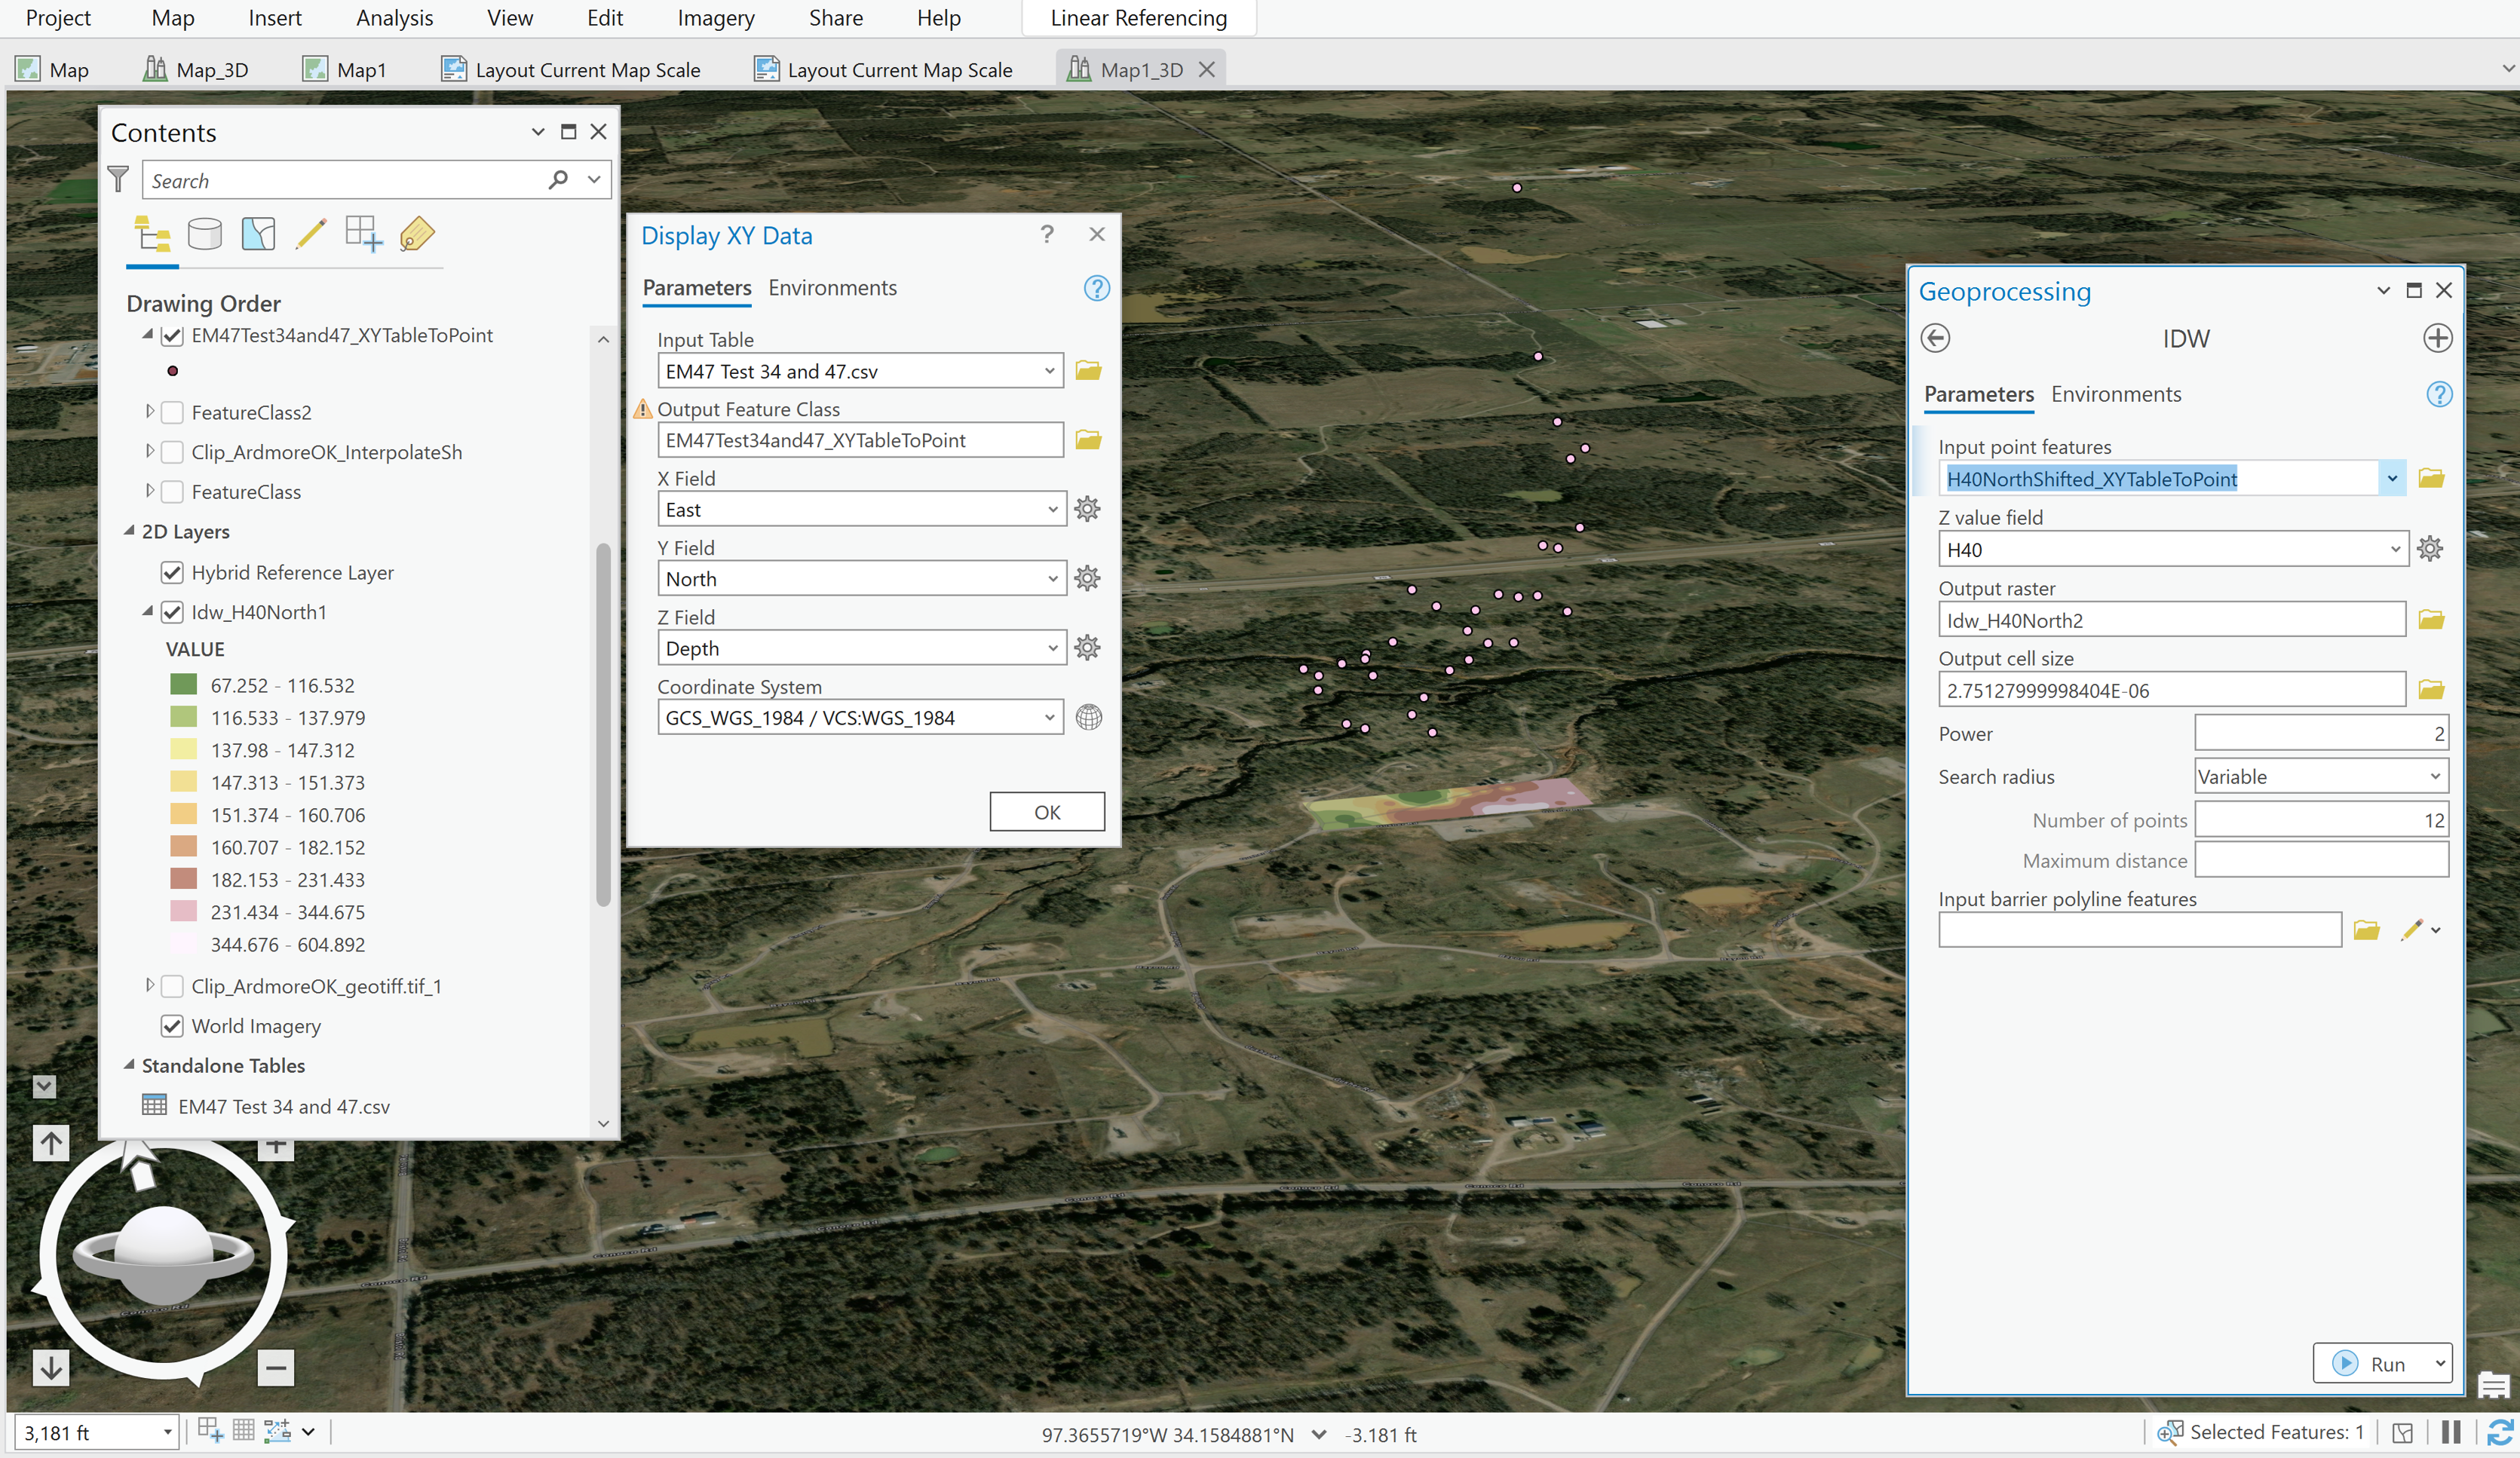
I have x and y cartesian coordinates and elevation values. I can plot in ArcGIS Pro under the Map tab, then choosing "Add Data", then choosing "Data add data to the map", then selecting the .csv format Excel file.
Under Stand Alone tables, right click, then choose "Display XY Data".
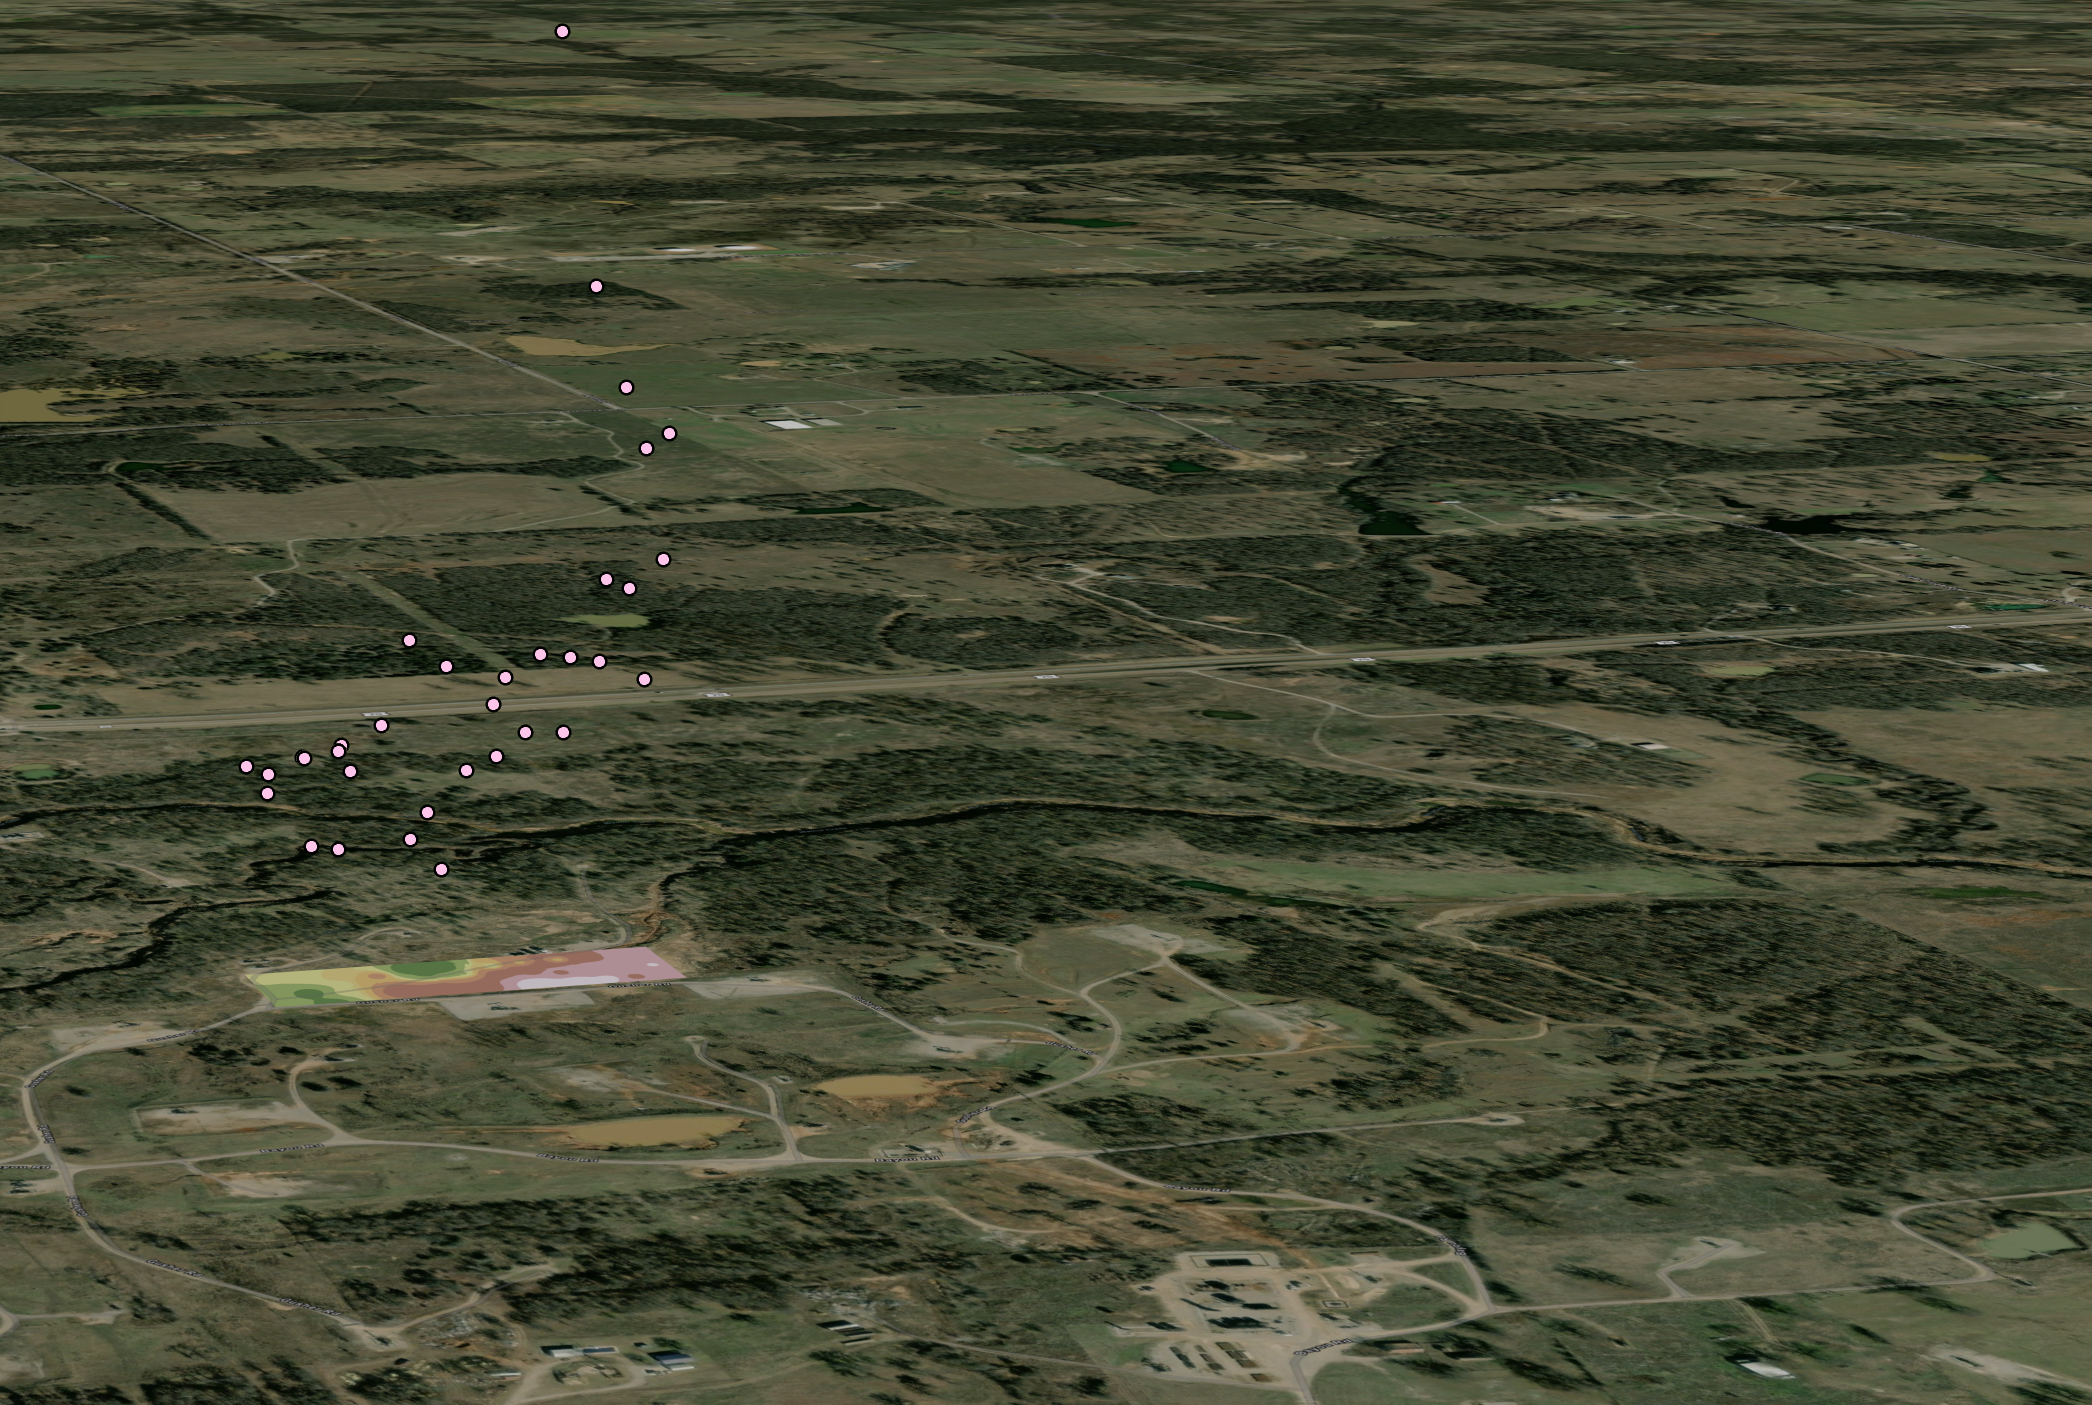
Spheres are then created at the x,y,z coordinates.
How can I analyze this set of data so that it is created in a 3-dimensional sphere/amorphous shape instead of a 2-dimensional rectangle (which happens when you use Analysis/Tools/Geoprocessing/IDW (3-D analyst tools)? Analysis is in a local scene so the viewpoint can be changed using the Navigator.
Analysis would be on a 4th Excel column (conductivity values) using kriging or IDW.
I'd like to see a blob shape with green for low values of conductivity and red for high values - I use the "condition number" color scheme.
I've experimented with a voxel scale in NetCDF, but it first creates a volumetric box, and then you have to slide a scale from you low values to high values.