Turn on suggestions
Auto-suggest helps you quickly narrow down your search results by suggesting possible matches as you type.
Cancel
- Home
- :
- All Communities
- :
- Products
- :
- ArcGIS Pro
- :
- ArcGIS Pro Questions
- :
- Re: How Can I possibly format/texture this box plo...
Options
- Subscribe to RSS Feed
- Mark Topic as New
- Mark Topic as Read
- Float this Topic for Current User
- Bookmark
- Subscribe
- Mute
- Printer Friendly Page
How Can I possibly format/texture this box plot ?
Subscribe
04-08-2020
07:10 AM
- Mark as New
- Bookmark
- Subscribe
- Mute
- Subscribe to RSS Feed
- Permalink
I have this box plot
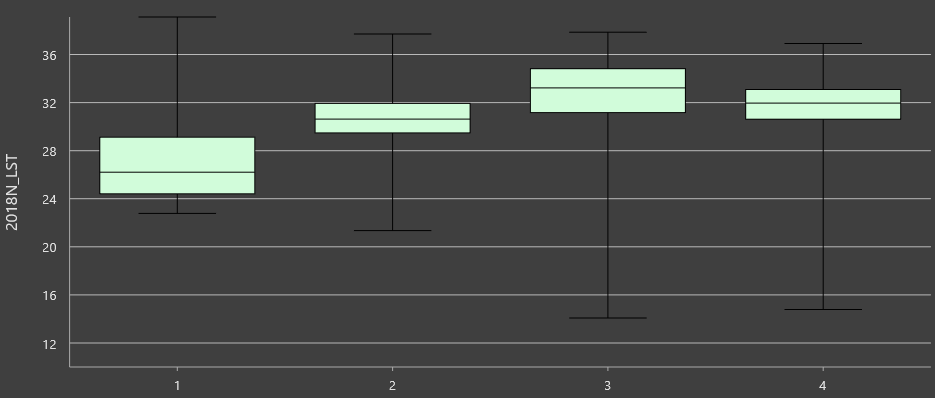 and I need to change the color of the box plot itself to look something like below. I know I can format the plot area, text, legend, etc, but how can format the plot itself. Se sample below.
Solved! Go to Solution.
1 Solution
Accepted Solutions
3 Replies
04-08-2020
09:58 AM
- Mark as New
- Bookmark
- Subscribe
- Mute
- Subscribe to RSS Feed
- Permalink
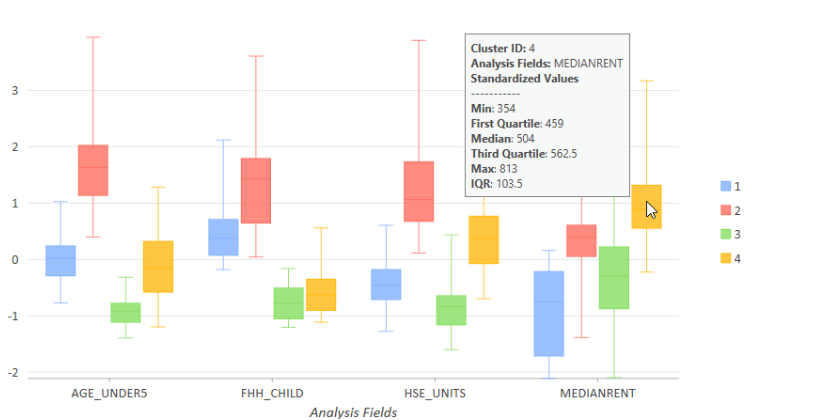
Andy - if I'm tracking your question correct, what you need to do is go the Box Plot chart properties, click Series, then Side-by-Side to get the desired layout. See my attached graphic using similar data for the City and County of Denver.

04-08-2020
12:08 PM
- Mark as New
- Bookmark
- Subscribe
- Mute
- Subscribe to RSS Feed
- Permalink
Hi Robert,
That was great, helpful. Thanks a lot.
'Andy.
04-08-2020
01:10 PM
- Mark as New
- Bookmark
- Subscribe
- Mute
- Subscribe to RSS Feed
- Permalink
You bet Andy! If you feel my answer is correct, please mark is to as to close out this thread. Good luck and stay healthy/safe!