- Home
- :
- All Communities
- :
- Products
- :
- ArcGIS Pro
- :
- ArcGIS Pro Questions
- :
- Hotspot Analysis results
- Subscribe to RSS Feed
- Mark Topic as New
- Mark Topic as Read
- Float this Topic for Current User
- Bookmark
- Subscribe
- Mute
- Printer Friendly Page
Hotspot Analysis results
- Mark as New
- Bookmark
- Subscribe
- Mute
- Subscribe to RSS Feed
- Permalink
Hi All,
I am performing an emerging hotspot analysis in ArcPro on my 14-year data. The space-time cube was created by aggregating data onto 1-year interval and using defined locations. After performing the emerging hotspot analysis, I used Visualize Space-Time Cube in 3D to display Hot and cold spot results year by year. I found the results did not match the hotspot pattern I got by running a separate HotSpot analysis on the same-year data, although the values are the same.
I was wondering whether I got something wrong here. Any advice? Thanks!
- Mark as New
- Bookmark
- Subscribe
- Mute
- Subscribe to RSS Feed
- Permalink
screen grabs of what you are referring to would help visualize
- Mark as New
- Bookmark
- Subscribe
- Mute
- Subscribe to RSS Feed
- Permalink
So when you say that the results of the Emerging Hot Spot Analysis didn't match those of Hot Spot Analysis (Getis-Ord G* ?), you just mean the symbology, right? Because the values are the same.
That makes sense because Hot Spot Analysis is symbolizing z score and p values at one time (a single time slice of a space time cube):

And when you visualize the space time cube through running Emerging Hot Spot Analysis, the symbology is representing the change over time.
How Emerging Hot Spot Analysis works—ArcGIS Help | ArcGIS Desktop
Note how the symbols represent a comparison over time:
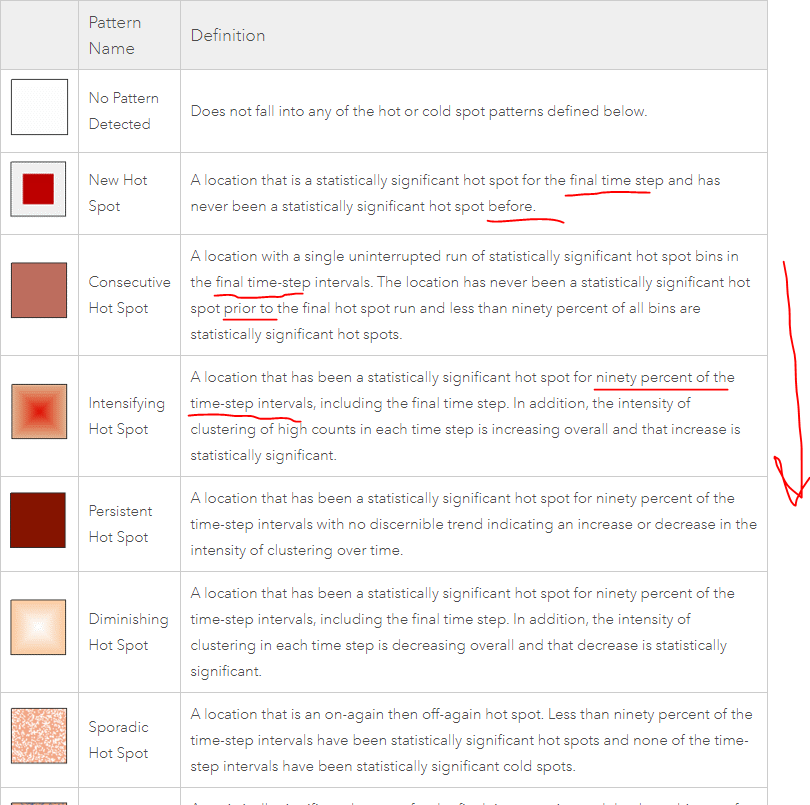
I'm not an expert in this realm, but I think this describes what you're seeing.