- Home
- :
- All Communities
- :
- Products
- :
- ArcGIS Pro
- :
- ArcGIS Pro Questions
- :
- Grouping a data frame whilst making a pie chart
- Subscribe to RSS Feed
- Mark Topic as New
- Mark Topic as Read
- Float this Topic for Current User
- Bookmark
- Subscribe
- Mute
- Printer Friendly Page
Grouping a data frame whilst making a pie chart
- Mark as New
- Bookmark
- Subscribe
- Mute
- Subscribe to RSS Feed
- Permalink
Hi everybody,
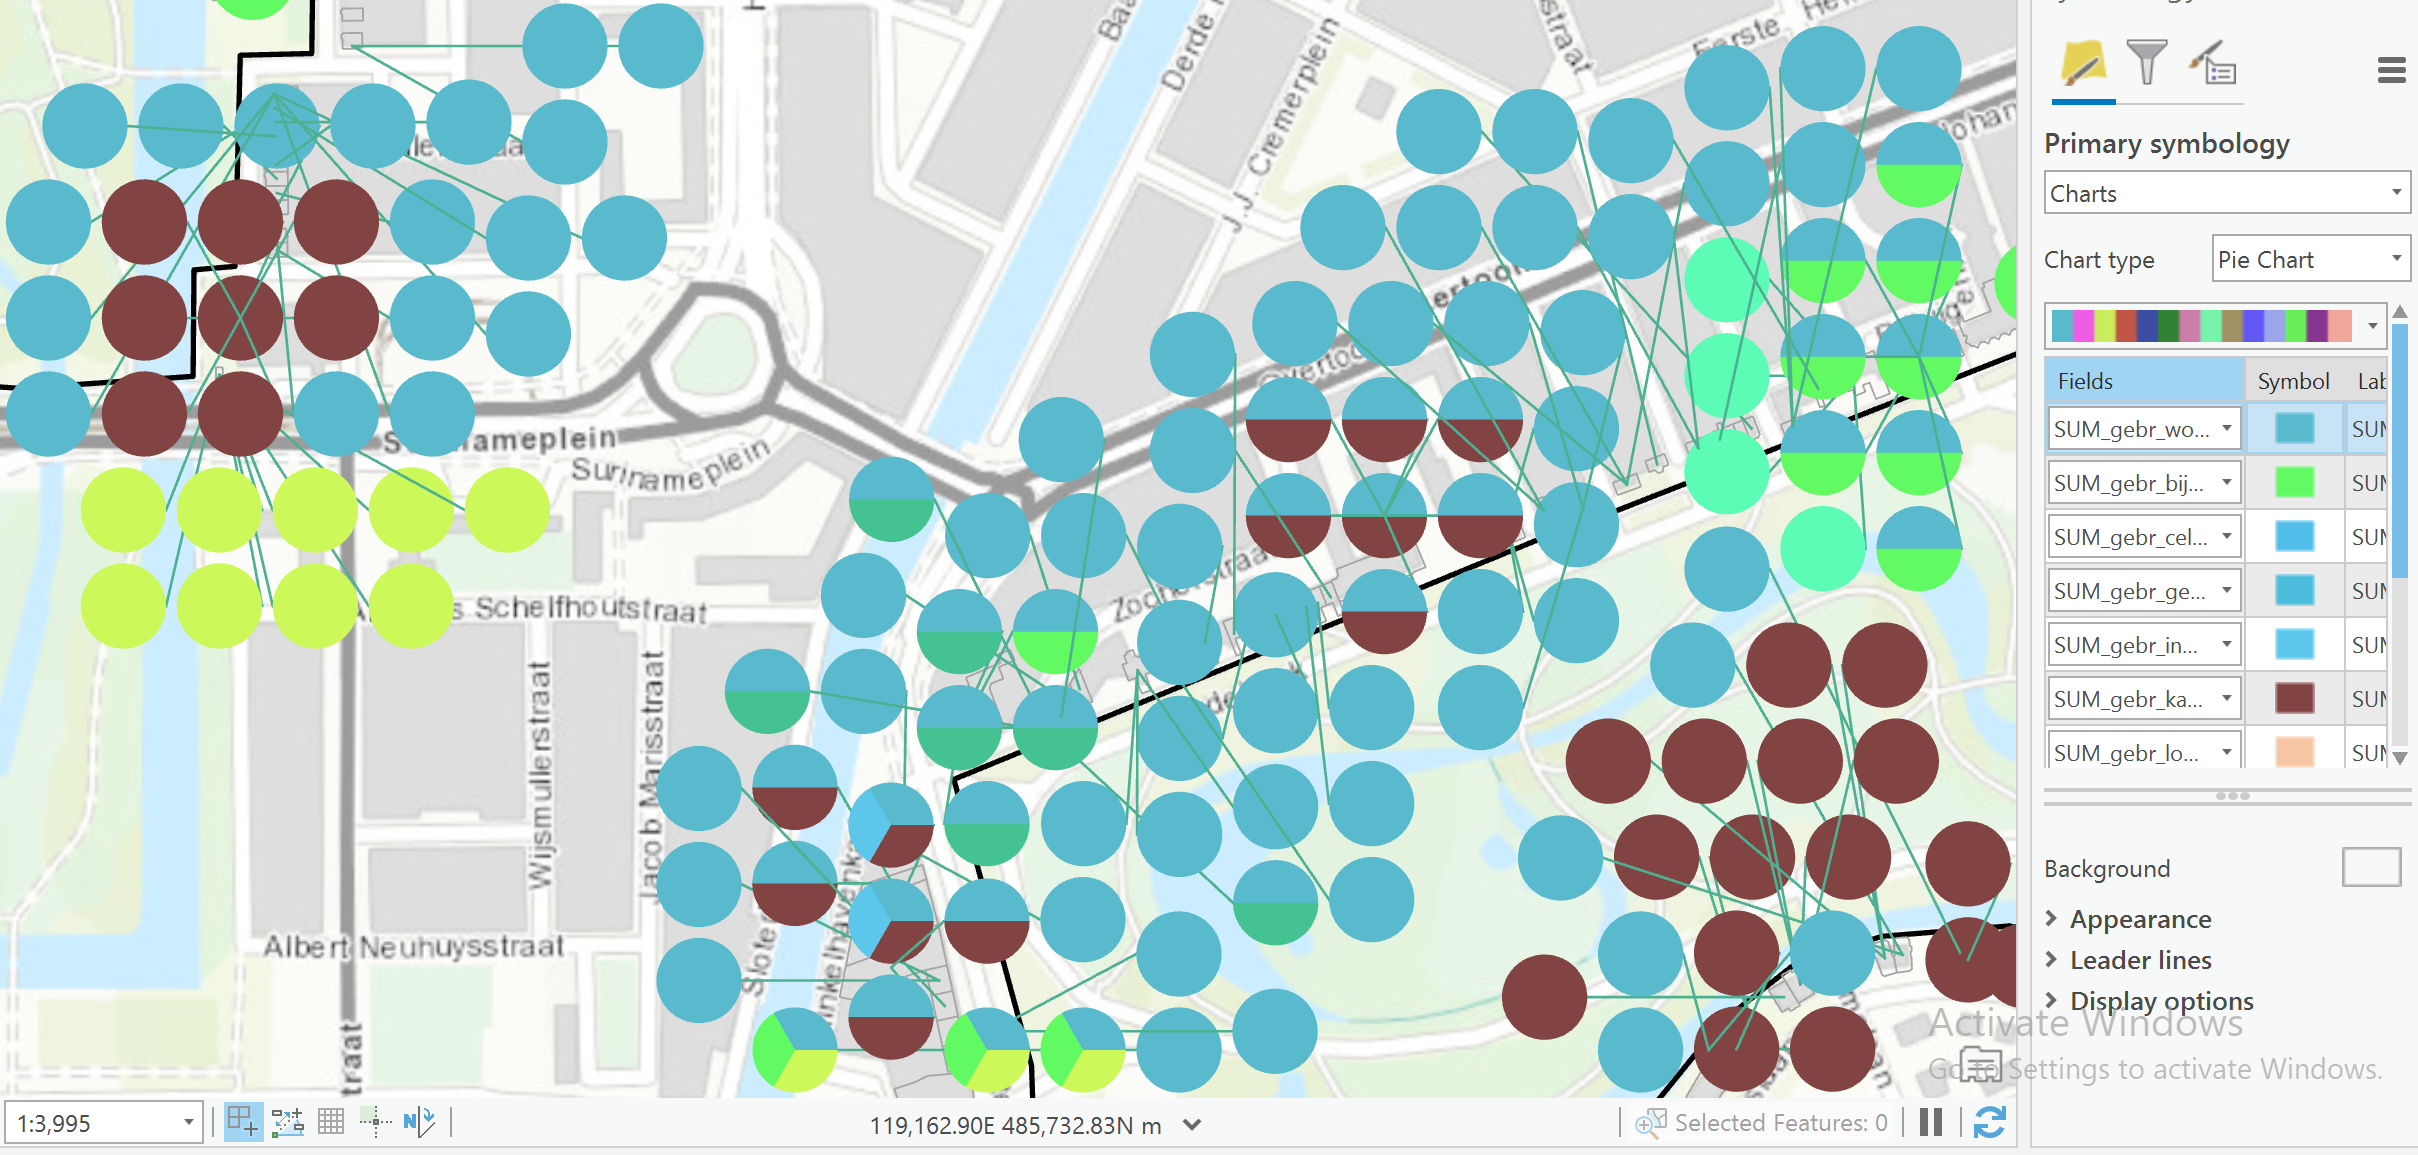
I have a data layer which consists of an attribute table of ~30 columns and ~6000 rows. This table contains information about buildings that are located close to parks in Amsterdam. I want to create a map in which I create for each park in Amsterdam a pie chart which shows the amount of buildings near that park. I know how to make the pie charts and how to display these on a map, the issue here is that I need to group the data to fall into parks. As of now, when I make the pie charts, the pie charts are made for EACH building (as I have 6000 buildings) and hence I need to group these buildings to each park. I have around 6000 observations for just 20 parks. So ideally I want to have 20 pie charts, one for each park.
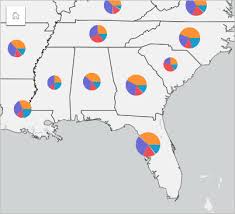
I used a few tools (e.g. summary statistics) but these all give me back a table and hence I cannot make pie charts out of this anymore. I have attached three screenshots, 1 of the table, 2 of the output I got (and which I want to group to parks). Lastly, I have attached an example of how I want my final outcome to look like (note: in this example the counties substitute the parks)
Solved! Go to Solution.
Accepted Solutions
- Mark as New
- Bookmark
- Subscribe
- Mute
- Subscribe to RSS Feed
- Permalink
Floris - I wonder if Summarize Nearby would work in this case. But be aware that this GP tool does consume ArcGIS credits if you use the "driving time" or "driving distance" for the Distance Measurement parameter. Reading the ArcGIS Pro help, it seems like this GP tool will create a new feature class that you can Sum the number of buildings within a distance of the parks
- Mark as New
- Bookmark
- Subscribe
- Mute
- Subscribe to RSS Feed
- Permalink
Hi Robert, thanks for your reply! I tried Summarize Nearby, and then as a group field I used "Name". However, the output is a grouped table, which I cannot visualize on a map.
- Mark as New
- Bookmark
- Subscribe
- Mute
- Subscribe to RSS Feed
- Permalink
Hi Robert, I tried it again this morning (this time using the data layer which I wanted to group as an "input feature" and the data layer I want to analyze/summarize as "Input summary feature") and it got the results I wanted, so thank you for that!