- Home
- :
- All Communities
- :
- Products
- :
- ArcGIS Pro
- :
- ArcGIS Pro Questions
- :
- Create a points layer from a .png image?
- Subscribe to RSS Feed
- Mark Topic as New
- Mark Topic as Read
- Float this Topic for Current User
- Bookmark
- Subscribe
- Mute
- Printer Friendly Page
- Mark as New
- Bookmark
- Subscribe
- Mute
- Subscribe to RSS Feed
- Permalink
I found a map online that displays a points layer. Unfortunately, I can't find a shapefile layer for the data online so I'd like to convert the image to a points layer somehow (for a school project). Is there an effective solution for this in ArcGIS Pro without manually converting every single point?
Solved! Go to Solution.
Accepted Solutions
- Mark as New
- Bookmark
- Subscribe
- Mute
- Subscribe to RSS Feed
- Permalink
There are ways, yes.
The easiest way would be to find the author of the map (someone in the U.S. Department of Agriculture) and ask them for the source data. These people don't bite, and the worst they can do is say no 🙂
Extracting the points yourself leads you into quite advanced topics, which are probably way out of scope for a school project.
But, for the sake of an example, I'll show one way to do it:
Luckily, the map you found is not in fact a png, but a pdf with vector data. You can recognize that by zooming in. If the content of the map gets pixely, it is a raster image (eg a png, jpg, gif, whatever). If it redraws at the new scale, it's vector data.
We can extract vector data from the pdf to load it into ArcGIS and further process it there. You can do that with Incscape, or by converting the pdf to a dxf file. There are many online converters available, they all produce different outputs. In this case, I got usable results with onlineconvertfree.
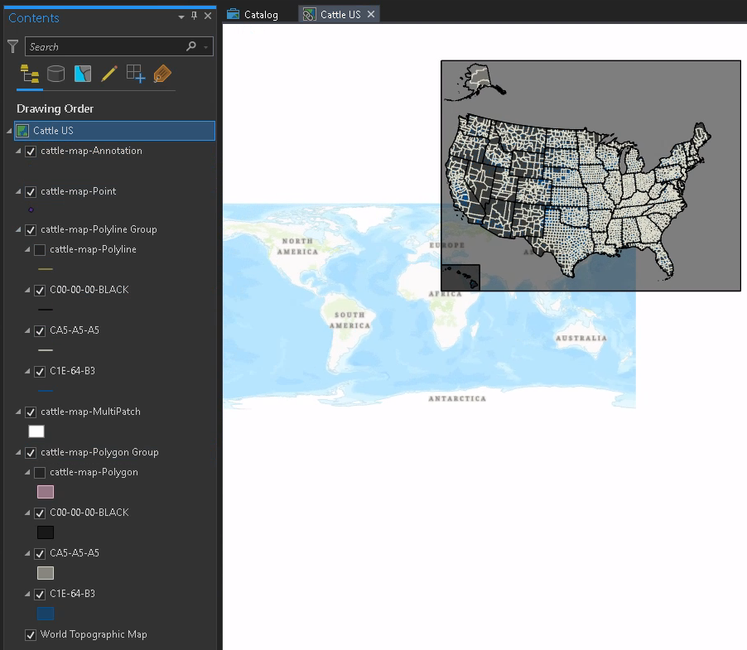
So, convert the pdf to dxf and load that file into ArcGIS Pro:
The dxf file actually contains multiple layers with the different geometry types. Sadly, the points of your map aren't actually stored as points, but as polygons. So we will have to convert them.
Also, the data doesn't have a coordinate system, so we have to do something about that.
Let's take a look at the pdf and see if there is anything in there about the coordinate system. We'll do this in Python.
import PyPDF2
from pprint import pprint

# read the first (and only) page of the pdf
pdf = "N:/bla/cattle_map.pdf"
reader = PyPDF2.PdfFileReader(pdf)
page = reader.pages[0]

# let's take a look
pprint(page)
#{'/Contents': IndirectObject(1, 0),
# '/MediaBox': [0, 0, 792, 612],
# '/Parent': IndirectObject(37, 0),
# '/Resources': IndirectObject(28, 0),
# '/Type': '/Page',
# '/VP': [{'/BBox': [58.20162, 469.49288, 692.41922, 43.1716],
#          '/Measure': IndirectObject(31, 0),
#          '/Name': 'US Data Frame',
#          '/Type': '/Viewport'},
#         {'/BBox': [54.0015, 575.9982, 212.4059, 475.19317],
#          '/Measure': IndirectObject(33, 0),
#          '/Name': 'AK Data Frame',
#          '/Type': '/Viewport'},
#         {'/BBox': [54.0015, 97.17429, 144.004, 35.97124],
#          '/Measure': IndirectObject(35, 0),
#          '/Name': 'HI Data Frame',
#          '/Type': '/Viewport'}]}

# The /VP key looks interesting. It includes the viewports for the continental US; Alaska, and Hawaii. Let's look at the US. The Measure parameter is still hidden.
pprint(page["/VP"][0]["/Measure"])
#{'/Bounds': [0, 1, 0, 0, 1, 0, 1, 1],
# '/GCS': IndirectObject(30, 0),
# '/GPTS': [21.6176,
#           -118.83703,
#           48.90833,
#           -128.98979,
#           49.20632,
#           -64.25761,
#           21.82903,
#           -74.06214],
# '/LPTS': [0, 1, 0, 0, 1, 0, 1, 1],
# '/Subtype': '/GEO',
# '/Type': '/Measure'}

# GCS is the abbreviation of Geographic Coordinate System. That should be what we're after.
pprint(page["/VP"][0]["/Measure"]["/GCS"])
#{'/Type': '/PROJCS',
# '/WKT': 'PROJCS["USA_Custom_Albers_Equal_Area_Conic_US",GEOGCS["GCS_North_American_1983",DATUM["D_North_American_1983",SPHEROID["GRS_1980",6378137.0,298.257222101]],PRIMEM["Greenwich",0.0],UNIT["Degree",0.0174532925199433]],PROJECTION["Albers"],PARAMETER["False_Easting",0.0],PARAMETER["False_Northing",0.0],PARAMETER["Central_Meridian",-96.0],PARAMETER["Standard_Parallel_1",29.5],PARAMETER["Standard_Parallel_2",45.5],PARAMETER["Latitude_Of_Origin",23.0],UNIT["Statute_Mile",1609.344]]'}

# Yep, there's the definition of the coordinate system. Let's store that in a variable.
wkt = page["/VP"][0]["/Measure"]["/GCS"]["/WKT"]
Now that we know the coordinate system, lets apply it to the map:
active_map = arcpy.mp.ArcGISProject("current").activeMap
active_map.spatialReference = arcpy.SpatialReference(text=wkt)
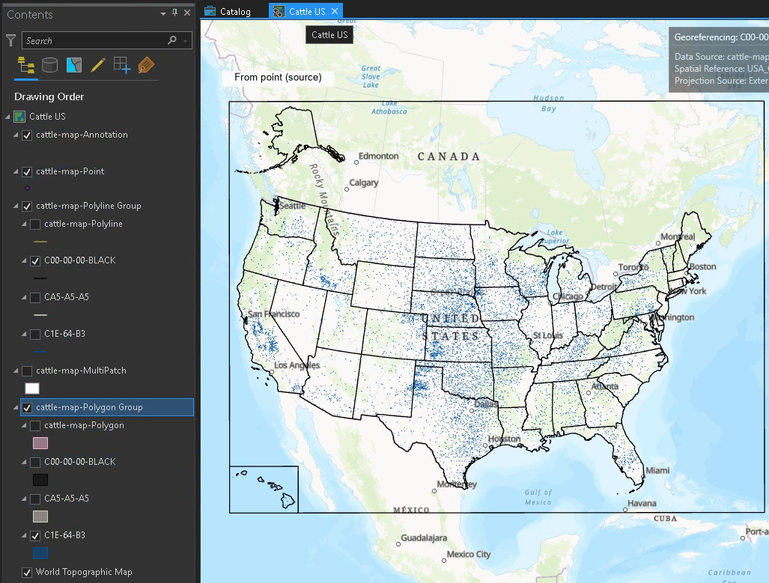
The coordinates in the pdf are wrong, so we need to georeference the dxw layer.
Now we can extract the polygons. There are probably good reasons for the custom projection, but it might be better to change the projection to something more widely used. I'm using WGS 84 here, which is the standard system used in GPS. We don't need to project every layer, only the "Polygon Group / C1E-64-B3" layer, which contains the points (as polygons).
arcpy.management.Project("cattle-map-Polygon Group/C1E-64-B3", "CattlePolygons", 4326)
Now we should probably do a little bit of cleanup: Every polygon appears twice in the featureclass (some remnant from converting from pdf to dxf), and the feature class includes the polygons from Hawaii and Alaska, which are now completely false. So we delete those polygons and then delete identical features:
arcpy.management.DeleteIdentical("CattlePolygons", ["Shape"])
That tool is actually not licensed for me and it would take too long to change my license right now, so I'll do it in the next step...
So now, everything that's left to do is to create points from the polygons:
# create the point feature class
arcpy.management.CreateFeatureclass("", "CattlePoints", "POINT", spatial_reference=arcpy.SpatialReference(4326))

# for each polygon, insert its centroid into the point fc, if it isn't already there
existing_coordinates = []
with arcpy.da.InsertCursor("CattlePoints", ["SHAPE@"]) as i_cursor:
    with arcpy.da.SearchCursor("CattlePolygons", ["SHAPE@"]) as s_cursor:
        for polygon, in s_cursor:
            point = polygon.centroid
            coordinates = [point.X, point.Y]
            if coordinates in existing_coordinates:
                continue
            existing_coordinates.append(coordinates)
            i_cursor.insertRow([point])
I'll attach the resulting shapefile to this post. This only includes the points for the continental USA. If you need Hawaii and Alaska, you'll have to ask for the data or do it yourself. Just start with georeferenceing the dxf to the respective state.
Have a great day!
Johannes
- Mark as New
- Bookmark
- Subscribe
- Mute
- Subscribe to RSS Feed
- Permalink
Does the image have real world coordinates? If not, then you would have to...
Register Raster (Data Management)—ArcGIS Pro | Documentation
You would probably have to do
Object Detection—ArcGIS Pro | Documentation
If the points were large enough to detect them from their surrounds.
The time taken would probably exceed that of doing the point layer manually unless extreme accuracy is required for the school project
... sort of retired...
- Mark as New
- Bookmark
- Subscribe
- Mute
- Subscribe to RSS Feed
- Permalink
There are ways, yes.
The easiest way would be to find the author of the map (someone in the U.S. Department of Agriculture) and ask them for the source data. These people don't bite, and the worst they can do is say no 🙂
Extracting the points yourself leads you into quite advanced topics, which are probably way out of scope for a school project.
But, for the sake of an example, I'll show one way to do it:
Luckily, the map you found is not in fact a png, but a pdf with vector data. You can recognize that by zooming in. If the content of the map gets pixely, it is a raster image (eg a png, jpg, gif, whatever). If it redraws at the new scale, it's vector data.
We can extract vector data from the pdf to load it into ArcGIS and further process it there. You can do that with Incscape, or by converting the pdf to a dxf file. There are many online converters available, they all produce different outputs. In this case, I got usable results with onlineconvertfree.
So, convert the pdf to dxf and load that file into ArcGIS Pro:
The dxf file actually contains multiple layers with the different geometry types. Sadly, the points of your map aren't actually stored as points, but as polygons. So we will have to convert them.
Also, the data doesn't have a coordinate system, so we have to do something about that.
Let's take a look at the pdf and see if there is anything in there about the coordinate system. We'll do this in Python.
import PyPDF2
from pprint import pprint

# read the first (and only) page of the pdf
pdf = "N:/bla/cattle_map.pdf"
reader = PyPDF2.PdfFileReader(pdf)
page = reader.pages[0]

# let's take a look
pprint(page)
#{'/Contents': IndirectObject(1, 0),
# '/MediaBox': [0, 0, 792, 612],
# '/Parent': IndirectObject(37, 0),
# '/Resources': IndirectObject(28, 0),
# '/Type': '/Page',
# '/VP': [{'/BBox': [58.20162, 469.49288, 692.41922, 43.1716],
#          '/Measure': IndirectObject(31, 0),
#          '/Name': 'US Data Frame',
#          '/Type': '/Viewport'},
#         {'/BBox': [54.0015, 575.9982, 212.4059, 475.19317],
#          '/Measure': IndirectObject(33, 0),
#          '/Name': 'AK Data Frame',
#          '/Type': '/Viewport'},
#         {'/BBox': [54.0015, 97.17429, 144.004, 35.97124],
#          '/Measure': IndirectObject(35, 0),
#          '/Name': 'HI Data Frame',
#          '/Type': '/Viewport'}]}

# The /VP key looks interesting. It includes the viewports for the continental US; Alaska, and Hawaii. Let's look at the US. The Measure parameter is still hidden.
pprint(page["/VP"][0]["/Measure"])
#{'/Bounds': [0, 1, 0, 0, 1, 0, 1, 1],
# '/GCS': IndirectObject(30, 0),
# '/GPTS': [21.6176,
#           -118.83703,
#           48.90833,
#           -128.98979,
#           49.20632,
#           -64.25761,
#           21.82903,
#           -74.06214],
# '/LPTS': [0, 1, 0, 0, 1, 0, 1, 1],
# '/Subtype': '/GEO',
# '/Type': '/Measure'}

# GCS is the abbreviation of Geographic Coordinate System. That should be what we're after.
pprint(page["/VP"][0]["/Measure"]["/GCS"])
#{'/Type': '/PROJCS',
# '/WKT': 'PROJCS["USA_Custom_Albers_Equal_Area_Conic_US",GEOGCS["GCS_North_American_1983",DATUM["D_North_American_1983",SPHEROID["GRS_1980",6378137.0,298.257222101]],PRIMEM["Greenwich",0.0],UNIT["Degree",0.0174532925199433]],PROJECTION["Albers"],PARAMETER["False_Easting",0.0],PARAMETER["False_Northing",0.0],PARAMETER["Central_Meridian",-96.0],PARAMETER["Standard_Parallel_1",29.5],PARAMETER["Standard_Parallel_2",45.5],PARAMETER["Latitude_Of_Origin",23.0],UNIT["Statute_Mile",1609.344]]'}

# Yep, there's the definition of the coordinate system. Let's store that in a variable.
wkt = page["/VP"][0]["/Measure"]["/GCS"]["/WKT"]
Now that we know the coordinate system, lets apply it to the map:
active_map = arcpy.mp.ArcGISProject("current").activeMap
active_map.spatialReference = arcpy.SpatialReference(text=wkt)
The coordinates in the pdf are wrong, so we need to georeference the dxw layer.
Now we can extract the polygons. There are probably good reasons for the custom projection, but it might be better to change the projection to something more widely used. I'm using WGS 84 here, which is the standard system used in GPS. We don't need to project every layer, only the "Polygon Group / C1E-64-B3" layer, which contains the points (as polygons).
arcpy.management.Project("cattle-map-Polygon Group/C1E-64-B3", "CattlePolygons", 4326)
Now we should probably do a little bit of cleanup: Every polygon appears twice in the featureclass (some remnant from converting from pdf to dxf), and the feature class includes the polygons from Hawaii and Alaska, which are now completely false. So we delete those polygons and then delete identical features:
arcpy.management.DeleteIdentical("CattlePolygons", ["Shape"])
That tool is actually not licensed for me and it would take too long to change my license right now, so I'll do it in the next step...
So now, everything that's left to do is to create points from the polygons:
# create the point feature class
arcpy.management.CreateFeatureclass("", "CattlePoints", "POINT", spatial_reference=arcpy.SpatialReference(4326))

# for each polygon, insert its centroid into the point fc, if it isn't already there
existing_coordinates = []
with arcpy.da.InsertCursor("CattlePoints", ["SHAPE@"]) as i_cursor:
    with arcpy.da.SearchCursor("CattlePolygons", ["SHAPE@"]) as s_cursor:
        for polygon, in s_cursor:
            point = polygon.centroid
            coordinates = [point.X, point.Y]
            if coordinates in existing_coordinates:
                continue
            existing_coordinates.append(coordinates)
            i_cursor.insertRow([point])
I'll attach the resulting shapefile to this post. This only includes the points for the continental USA. If you need Hawaii and Alaska, you'll have to ask for the data or do it yourself. Just start with georeferenceing the dxf to the respective state.
Have a great day!
Johannes
- Mark as New
- Bookmark
- Subscribe
- Mute
- Subscribe to RSS Feed
- Permalink
I have learned SO much from this. Thank you so much! I had initially said .png since I took a screenshot of the pdf to import into ArcGIS Pro and was stuck from there... I've tried to contact the source as well but I'm afraid I won't get a response in time. Happy holidays!


