- Home
- :
- All Communities
- :
- Products
- :
- ArcGIS Pro
- :
- ArcGIS Pro Questions
- :
- Combine issue with least-cost path
- Subscribe to RSS Feed
- Mark Topic as New
- Mark Topic as Read
- Float this Topic for Current User
- Bookmark
- Subscribe
- Mute
- Printer Friendly Page
- Mark as New
- Bookmark
- Subscribe
- Mute
- Subscribe to RSS Feed
- Permalink
My apologies in advance for what is likely a rather ignorant question, but I could not find any answers online to my issue. I'm entirely self-taught with ArcGIS Pro 2.3 and have been using it to create some least-cost paths for my dissertation in history. I've been using a DEM up until now for my paths, there being a lack of satellite surface data for seventh-century Italy. I want to add in some Roman roads to see how this would affect the paths. So I made the road in my study area in a polyline, which I then converted to a raster. I then took my DEM and calculated the slope, like I always would when doing a least-cost path, and then I reclassified the slope, with the lowest values having the least slope. Next, I reclassified the road polyline, giving the whole thing a value of 1. Then I ran the combine tool, and what I got is the line in the image. It combined them just fine, but somewhere along the way it removed the rest of the slope raster! I tried weighted overlay, but that did not change anything. What did I do wrong?
Solved! Go to Solution.
Accepted Solutions
- Mark as New
- Bookmark
- Subscribe
- Mute
- Subscribe to RSS Feed
- Permalink
Your non-road areas are NoData I suspect, which won't combine with anything. You need to make your 'road' raster 0 (non-road) and 1 (road)
- Mark as New
- Bookmark
- Subscribe
- Mute
- Subscribe to RSS Feed
- Permalink
Your non-road areas are NoData I suspect, which won't combine with anything. You need to make your 'road' raster 0 (non-road) and 1 (road)
- Mark as New
- Bookmark
- Subscribe
- Mute
- Subscribe to RSS Feed
- Permalink
Yes, thank you! That's exactly the answer and it does the trick.
If I can ask a follow-up question, is the result displayed in the image on account of the averaging of the numbers? The red line is the original polyline I drew. The faint line to the left is the least-cost path resulting only from the DEM (is there a way to make these more visible without touching them up in the layout view later?) The green is the new least-cost path from the DEM + road. It more or less follows the road's contours. I had expected it to follow it more precisely, given that it's an upland region and rather far from the other result. Is this just a result of the program averaging out some numbers?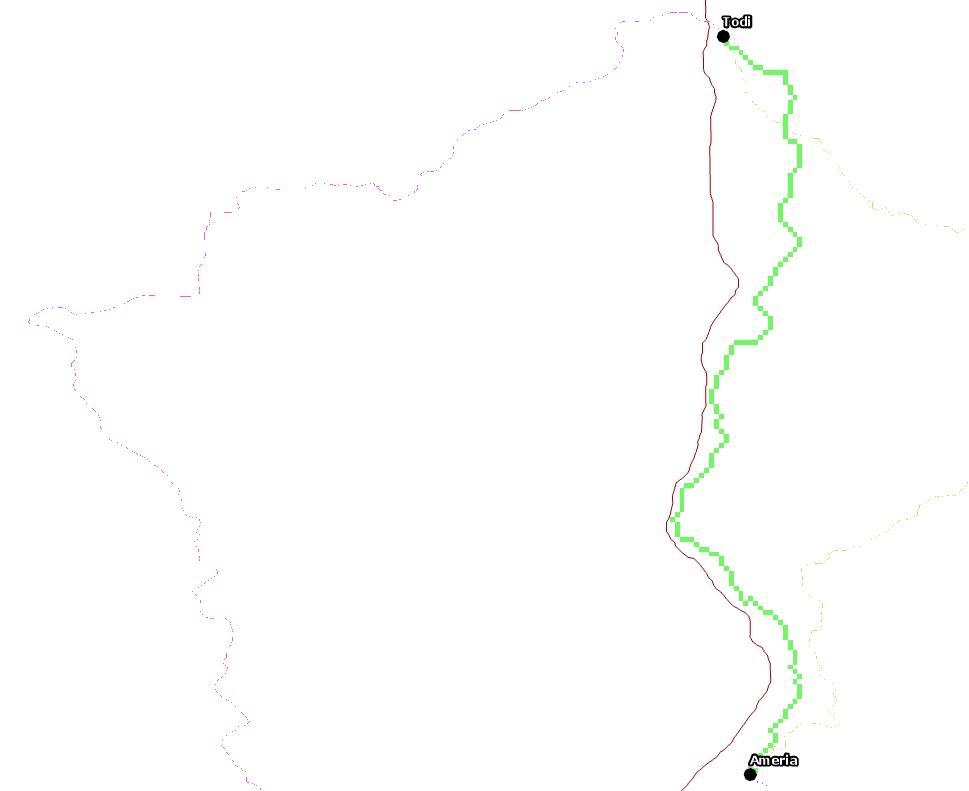
- Mark as New
- Bookmark
- Subscribe
- Mute
- Subscribe to RSS Feed
- Permalink
I Use ArcGIS Pro Lucas
Cost Path as Polyline—Help | ArcGIS Desktop
Your cell size for the path on the left is due to the smaller cell size making the path look thin and spotty.
If you want to 'see' it, then you need a polyline so you can symbolize appropriately, or you will have to emulate a thicker route for visualization purposes only.
will do this (try a factor of 2 first, then 3. Again, this is for visualization purposes.... the original costpath will be for the analytical side
- Mark as New
- Bookmark
- Subscribe
- Mute
- Subscribe to RSS Feed
- Permalink
Hi Dan,
I seem to have lost the ability to submit a separate question to the forum, so I'm just going to reply to this thread, since it is along the lines of what I'm trying to do. I need to calculate a least cost path from a set of points to a set of polylines (each point should have one resulting LCP to whichever line is best). I also would like the cost analysis to take both directions into consideration. I've read through the various help pages, and honestly it was difficult for me to interpret, so I apologize if it is explained somewhere but I missed it. I've looked at LCP, cost path as polyline, distance accumulation... none of them seem to be meant for point to polyline. Any help would be much appreciated. 🙂