- Home
- :
- All Communities
- :
- Products
- :
- ArcGIS Pro
- :
- ArcGIS Pro Questions
- :
- Chart options - Missing aggregation maximum and mi...
- Subscribe to RSS Feed
- Mark Topic as New
- Mark Topic as Read
- Float this Topic for Current User
- Bookmark
- Subscribe
- Mute
- Printer Friendly Page
Chart options - Missing aggregation maximum and minimum options
- Mark as New
- Bookmark
- Subscribe
- Mute
- Subscribe to RSS Feed
- Permalink
Hello,
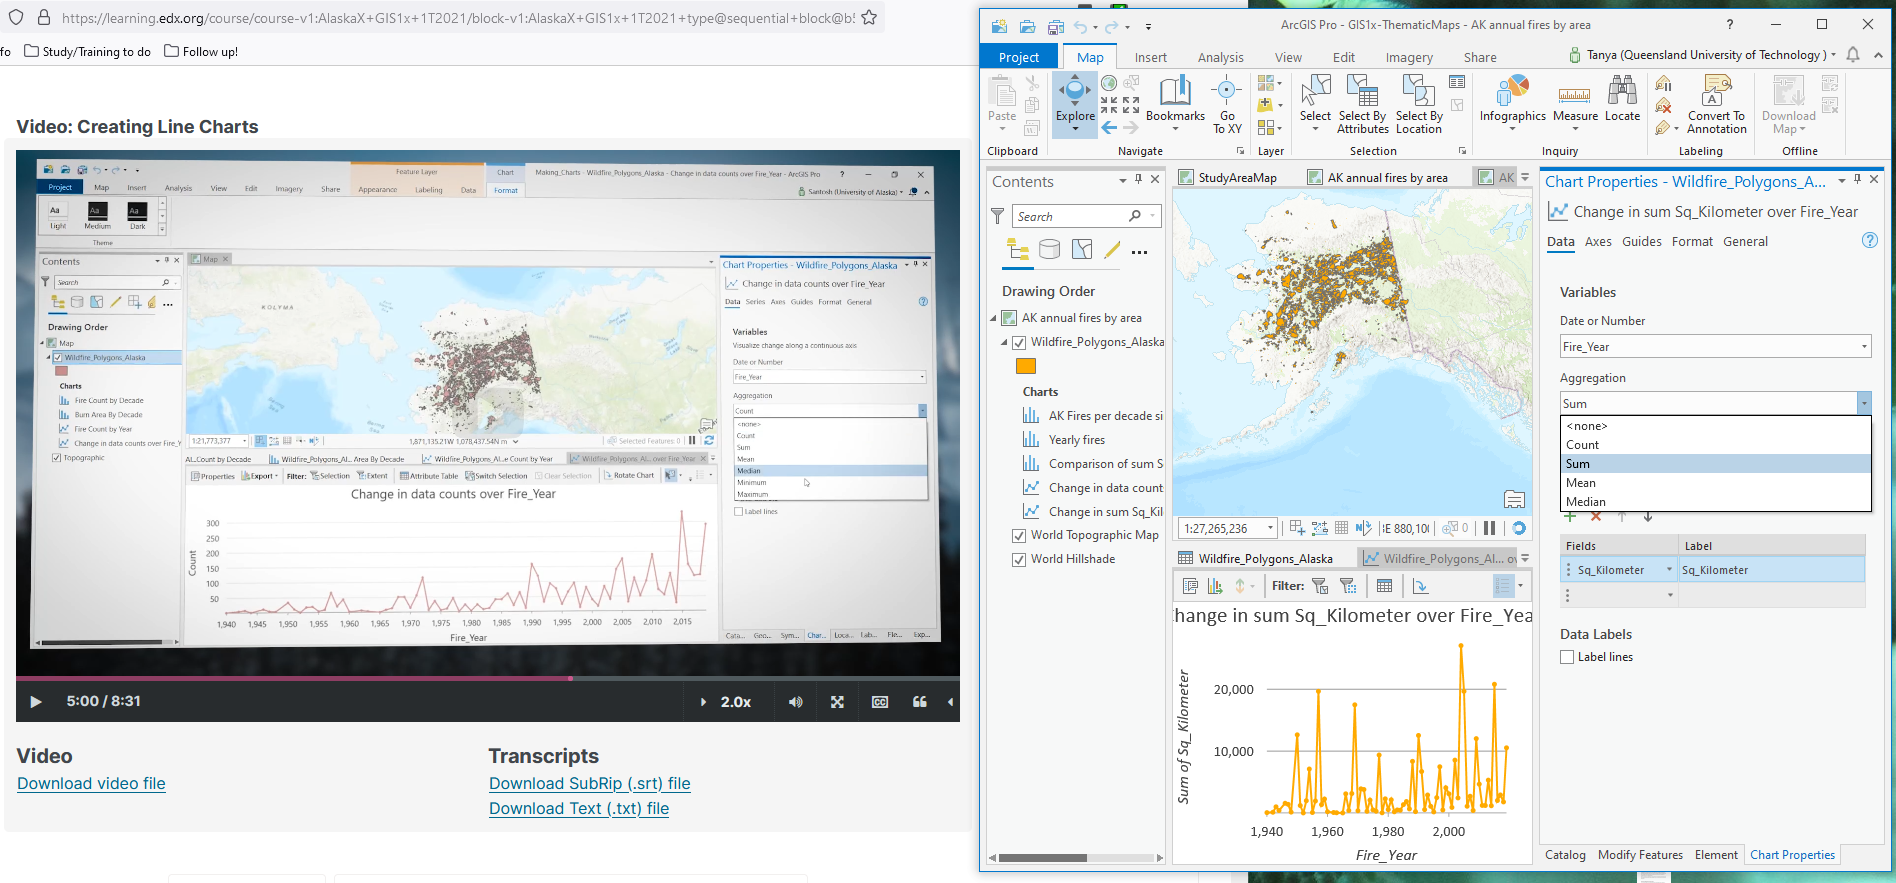
I am a new user just working my way through an ArcGIS Pro course series on the website edx.org. In the lesson on creating charts, the "aggregation" field shows options: Count, sum, mean, median, maximum, minimum. However doing the exact same thing in ArcPro desktop, my only options are count, sum, mean and median. So cannot, for this particular example, make a line chart showing the biggest fire (km2) documented in each year - while the video presenter easily can by setting aggregation to maximum.
Is there some way to get this functionality?
My information is:
Product version: ArcGIS Pro 2.3.0.15769
Operating system: Windows 10 Enterprise 19042 64-bit
System display language: en-AU
Software display language: en-US
Solved! Go to Solution.
Accepted Solutions
- Mark as New
- Bookmark
- Subscribe
- Mute
- Subscribe to RSS Feed
- Permalink
Hi @TRD ,
The minimum and maximum aggregations were introduced in version 2.7 of Pro.
Thanks for the question!
Chris
- Mark as New
- Bookmark
- Subscribe
- Mute
- Subscribe to RSS Feed
- Permalink
Hi @TRD ,
The minimum and maximum aggregations were introduced in version 2.7 of Pro.
Thanks for the question!
Chris