- Home
- :
- All Communities
- :
- Products
- :
- ArcGIS Pro
- :
- ArcGIS Pro Questions
- :
- ArGIS Pro 2.1 | How to create pie charts?
- Subscribe to RSS Feed
- Mark Topic as New
- Mark Topic as Read
- Float this Topic for Current User
- Bookmark
- Subscribe
- Mute
- Printer Friendly Page
ArGIS Pro 2.1 | How to create pie charts?
- Mark as New
- Bookmark
- Subscribe
- Mute
- Subscribe to RSS Feed
- Permalink
bar, proportional symbols, but pie charts aren't there even in beta 2.2. Help is currently down, so you will have to wait to see the link for unsupported tools
- Mark as New
- Bookmark
- Subscribe
- Mute
- Subscribe to RSS Feed
- Permalink
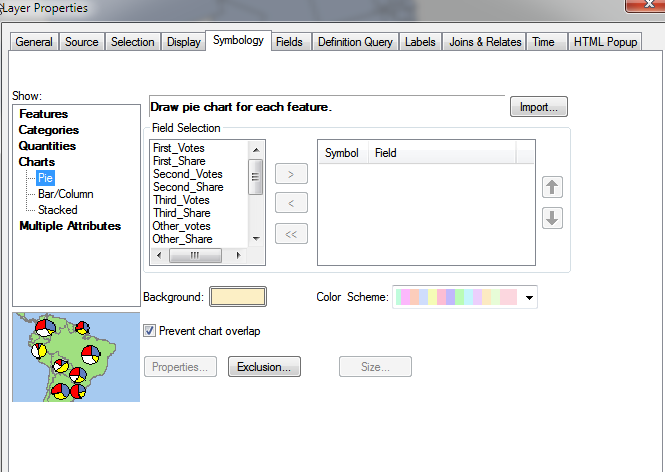
This is not yet in ArcGIS Pro. There is an enhancement logged with technical support [ENH-000109862: Provide a functionality in ArcGIS Pro to use Pie, Bar/Column and Stacked chart information as symbology renderer for features and to be able to label the chart information.]
- Mark as New
- Bookmark
- Subscribe
- Mute
- Subscribe to RSS Feed
- Permalink
Hi, I have a supportcase on this topic. Any news on what happened to the "pie's in Pro"?
- Mark as New
- Bookmark
- Subscribe
- Mute
- Subscribe to RSS Feed
- Permalink
None in beta 2.4 either
- Mark as New
- Bookmark
- Subscribe
- Mute
- Subscribe to RSS Feed
- Permalink
Thanks Dan Patterson ! Glad someone have the time and nerves to betatest. Just tried making a LYR (with PieCharts symbology) and import it to Pro. It kind-of works (no ability for fine-tuning in Pro 2.3.3).