- Home
- :
- All Communities
- :
- Products
- :
- ArcGIS Pro
- :
- ArcGIS Pro Ideas
- :
- Reclassify for vector data
- Subscribe to RSS Feed
- Mark as New
- Mark as Read
- Bookmark
- Follow this Idea
- Printer Friendly Page
- Mark as New
- Bookmark
- Subscribe
- Mute
- Subscribe to RSS Feed
- Permalink
A reclassify tool for vector data would be incredibly useful. Essentially it would act as a way to cement symbology within the attribute table.
I recently came across the need to take median household income and categorize over 500 records (polygons) into quartiles. You can easily do this using display symbology, but I wanted to create a field in the attribute table with values of 1, 2, 3, or 4 for each record to denote what quartile that particular record fell into based on the income value. I wanted this data to be in the attribute table so I could perform further geoprocessing by choosing records by quartile classification.
To be most useful, this tool would leave the original field data intact and create a new field with the new values. For my needs, the ability to break the data into ranges is important.
I was able to get the result I wanted by using the symbology aspect of the Properties for my layer to determine where the quartile breaks should be, jot them down, and then use a python script to calculate a new field. I told the GIS to take particular ranges of data (quartiles) and assign those records appropriate values (1, 2, 3, 4). This works, but it is tedious and time-consuming. If a geogprocessing tool could do the same thing, it would make things much more efficient.
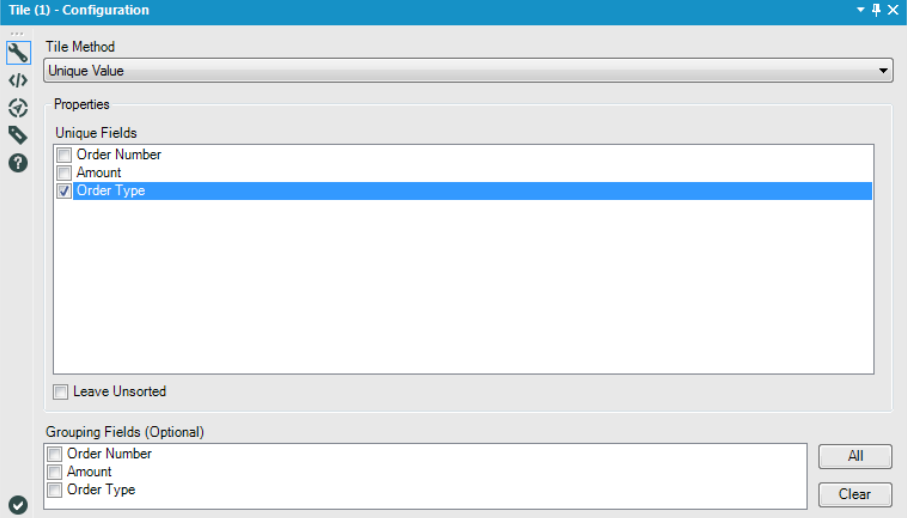
Basically, we need a "tile" tool. Not to be confused with map tiles. Tile= Quintile, Quantile, Decile, etc.
We do this within a different analysis software. If esri could get this added, that would be great.
Pick the "tile" method, pick the field(s) to tile by/reclassify, and secondary grouping fields as needed.

Implemented in ArcGIS Pro 2.7 with Reclassify Field (Data Management)—ArcGIS Pro | Documentation
See Ideas in ArcGIS Pro 2.7: Something to Celebrate
And check out what's new in ArcGIS Pro 2.7!
You must be a registered user to add a comment. If you've already registered, sign in. Otherwise, register and sign in.