- Home
- :
- All Communities
- :
- Products
- :
- ArcGIS Pro
- :
- ArcGIS Pro Ideas
- :
- Profile Graph for Non-Elevation Data
- Subscribe to RSS Feed
- Mark as New
- Mark as Read
- Bookmark
- Follow this Idea
- Printer Friendly Page
Profile Graph for Non-Elevation Data
- Mark as New
- Bookmark
- Subscribe
- Mute
- Subscribe to RSS Feed
- Permalink
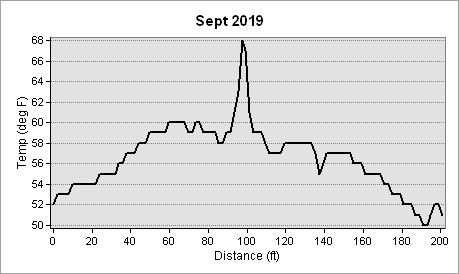
In ArcMap the functionality of 3D Analyst for making a profile graph was more robust and less limiting. A user could generate a profile graph of just about any raster regardless of the raster data whether the raster depicts elevation or not. For example, one may deal with infrared flyover data that is used to identify pockets of heat that are near-surface. Different snapshots through time can show seasonal swings of ground temperature, as well as the dissipation of a potential geothermal source. In ArcMap one can interpolate a line and then make a profile graph all in the click of several buttons! And the data set being used did not have to have elevation values in feet, meters, kilometers, or kitty cats! It did not matter what the units were as the subsequent profile graph could be customized. The output of the graph units can better be defined and depicted base on what the user is dealing with. This functionality should be brought into ArcGIS Pro so users do not have to default to ArcMap to be able to complete their non-elevation-centric exercises and analyses.
As good as ArcGIS Pro is, here is a great example of bringing all the functionality of ArcMap into Pro.
The functionality we have in ArcMap should be enhanced in ArcMap Pro not limited or eliminated.
Are you using 2.7? I haven't checked on how exactly this was implemented, but if the exact title of Pro: Add the Profile Graph Tool as it works in ArcMap was implemented, then this should work.
Hi @ThomasColson . Yes, I am using 2.7. Yes, the tool does work; however, it does not work the way it did in ArcMap. My issue with the current version of the tool, in Pro 2.7, is that it will only handle elevation data. This was not the case in ArcMap. I could customize the graphs so that I could deal with other data types and generate profile graphs. If this was concentration levels in ppm, TDS, or even temperature, I could draw a profile graph and not have issues with the units as I could customize them on the graph. This simply does not appear to be the case. I looked into and saw your post before creating this Idea as I had hoped that this was just an "operator error", but that does not appear to be the case. Please let me know if you have any further ideas or if I have indeed missed something here.
Again, the issue is that I am not working with elevation data and so the profile graph needs to have the ability to be customized as one was able to do in ArcMap.
Thanks!
This was implemented in ArcGIS Pro 3.2 with the Surface Profile chart: https://pro.arcgis.com/en/pro-app/3.2/help/data/imagery/surface-profile-chart.htm
You must be a registered user to add a comment. If you've already registered, sign in. Otherwise, register and sign in.