- Home
- :
- All Communities
- :
- Products
- :
- ArcGIS Pro
- :
- ArcGIS Pro Ideas
- :
- one multipurpose symbol system for displaying cate...
- Subscribe to RSS Feed
- Mark as New
- Mark as Read
- Bookmark
- Follow this Idea
- Printer Friendly Page
one multipurpose symbol system for displaying categorical data from many variables
- Mark as New
- Bookmark
- Subscribe
- Mute
- Subscribe to RSS Feed
- Permalink
Background/problem:
I recently was asked to make a map that would show district level data for a public health program that wanted to see many different variables all on the same map that could be printed as a poster. They wanted to know infection prevelance, symptom prevalence, and then the prevalence of other factors that can contribute or deter both of those things. Ultimately, the key thing to realize with my issue is that there were too many variables to be portrayed all at once for the map to still appear tidy and organized. I filled each district in with a color for a categorical infection prevalence range, I put a color coded lattice with a hollow background to portray symptom prevalence category, I was then challenged with how I can represent other categorical variables for each of these districts on top of the shapefile with its districts colored in.
I ended up putting a circle for one variable that was color coded with a semi-circle (also being color coded) as a second source of data. This becomes an issue because I am running out of colors to use and they are starting to be tough on the eye. See the examples below that show the circles and colors.


My suggestion:
What I would like to be able to do is split the categories of one variable (lets call it variable A) by shape (e.g. circle, triangle, diamond, square, etc) and then color those shapes based on a scale that categorized a variable (variable B) that was different from the variable A that determined the shape. Alternatively, although I think this would work less well, I would like to be able to use one shape that had a different size for variable A and then use a color system to portray categories in variable B. This is probably getting a bit crazy but to extend my point, it would be really cool to have all three of these options (size, shape and color) represent different variables for each district while also portraying the fill colors/patterns for each district beneath these symbols.
Things I have tried:
I have played with the option that allows us to map multiple attributes but with this many variables, the number of categories becomes way too many to tell the difference in a colored scale. Also, it doesn't allow us to highlight specific pairs of variables like my infection vs symptom prevalence shown in the fill and lattice while also comparing the contributing and determining factors shown in the symbol and symbol color. All possible combinations are just placed into the color ramp you choose with the added option of having a shape vary in size to represent a specific variable.
Have you tried working with attribute-driven symbology in ArcGIS Pro yet?
Attribute-driven symbology—ArcGIS Pro | ArcGIS Desktop
You can do some of what you're requesting above:
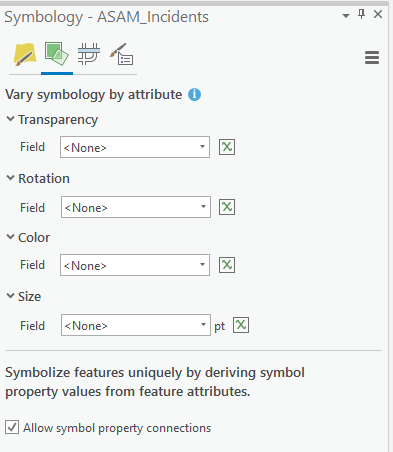
And create symbol property connections.
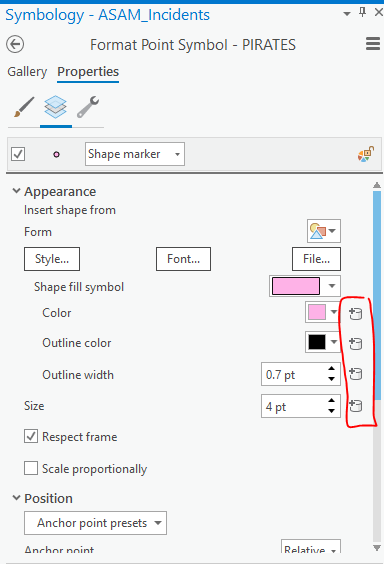
But not specifically for the symbol shape. That has been requested here:
You must be a registered user to add a comment. If you've already registered, sign in. Otherwise, register and sign in.