- Home
- :
- All Communities
- :
- Products
- :
- ArcGIS Parcel Fabric
- :
- ArcGIS Parcel Fabric Questions
- :
- Really bad performance: Dirty Area layer takes min...
- Subscribe to RSS Feed
- Mark Topic as New
- Mark Topic as Read
- Float this Topic for Current User
- Bookmark
- Subscribe
- Mute
- Printer Friendly Page
Really bad performance: Dirty Area layer takes minutes to display
- Mark as New
- Bookmark
- Subscribe
- Mute
- Subscribe to RSS Feed
- Permalink
Hello,
We are using parcel fabric 11.1 with ArcGIS Pro 3.1.4 and Database SQL Server Standard 2019 We have a parcel fabric with 1.5 millions parcels. When we use Parcel Fabric and do not turn on dirty area, Parcel Fabric behaves Ok, with over 13 people editing at the same time.
if no body is connected and editing on parcel fabric, display dirty area takes almost 1.5 minutes but when all are connected, it takes almost 3 minutes to display.
we did some test using SQL Server Trace and found out that dirty area takes a lot.
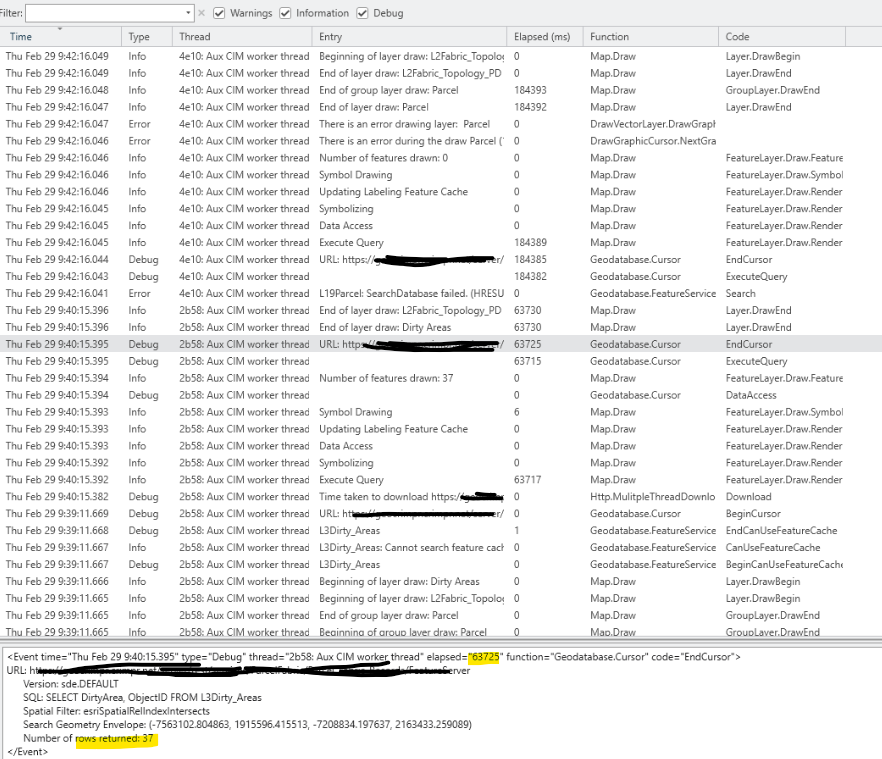
And when we used ArcGIS Pro diagnostic Monitor, we found a same behavior but, it only returns 37 rows, and other, 0 rows.
We did this diagnostic also when we have validated all dirty area and the time to load the layers was the same.
So my question is, why Dirty area layer has so bad performance, what could be the reason for this behavior.
Thanks,
Diego Llamas
- Mark as New
- Bookmark
- Subscribe
- Mute
- Subscribe to RSS Feed
- Permalink
How many rows are returned when you run the GetCount geoprocessing tool (or when you open the attribute table)? This is how many dirty areas are 'active' in your version.
How many rows are in the dirty areas table if you do a count statement directly against the table using SQL? This is the total number of active and historical records in your geodatabase.
- Mark as New
- Bookmark
- Subscribe
- Mute
- Subscribe to RSS Feed
- Permalink
Hi @RobertKrisher, we have in the Default version...
406,549 records when the tool ran or we open the attributes table.
411,808 records when using querying directly in the database.
Don't understand how so many records are still showing in the table since we validated and cleared everything during the weekend and as today just a few dirty areas are displaying when the layer is on. Stats in the tables are updated and indexes are rebuilt recently. As @DiegoLlamasOlivares mentioned performance is very poor for some reason.

