- Home
- :
- All Communities
- :
- Products
- :
- ArcGIS Parcel Fabric
- :
- ArcGIS Parcel Fabric Questions
- :
- Re: Really bad performance: Dirty Area layer takes...
- Subscribe to RSS Feed
- Mark Topic as New
- Mark Topic as Read
- Float this Topic for Current User
- Bookmark
- Printer Friendly Page
Really bad performance: Dirty Area layer takes minutes to display

- Mark as New
- Bookmark
- Subscribe to RSS Feed
- Permalink
Hello,
We are using parcel fabric 11.1 with ArcGIS Pro 3.1.4 and Database SQL Server Standard 2019 We have a parcel fabric with 1.5 millions parcels. When we use Parcel Fabric and do not turn on dirty area, Parcel Fabric behaves Ok, with over 13 people editing at the same time.
if no body is connected and editing on parcel fabric, display dirty area takes almost 1.5 minutes but when all are connected, it takes almost 3 minutes to display.
we did some test using SQL Server Trace and found out that dirty area takes a lot.
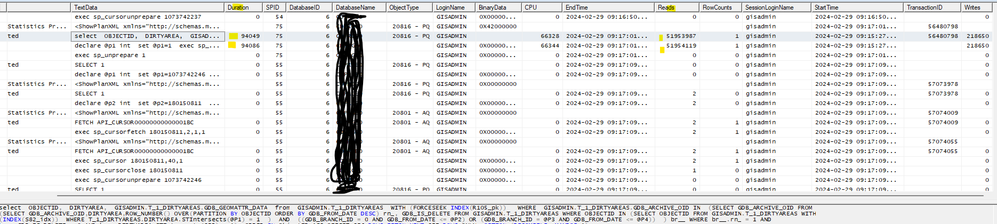
And when we used ArcGIS Pro diagnostic Monitor, we found a same behavior but, it only returns 37 rows, and other, 0 rows.
We did this diagnostic also when we have validated all dirty area and the time to load the layers was the same.
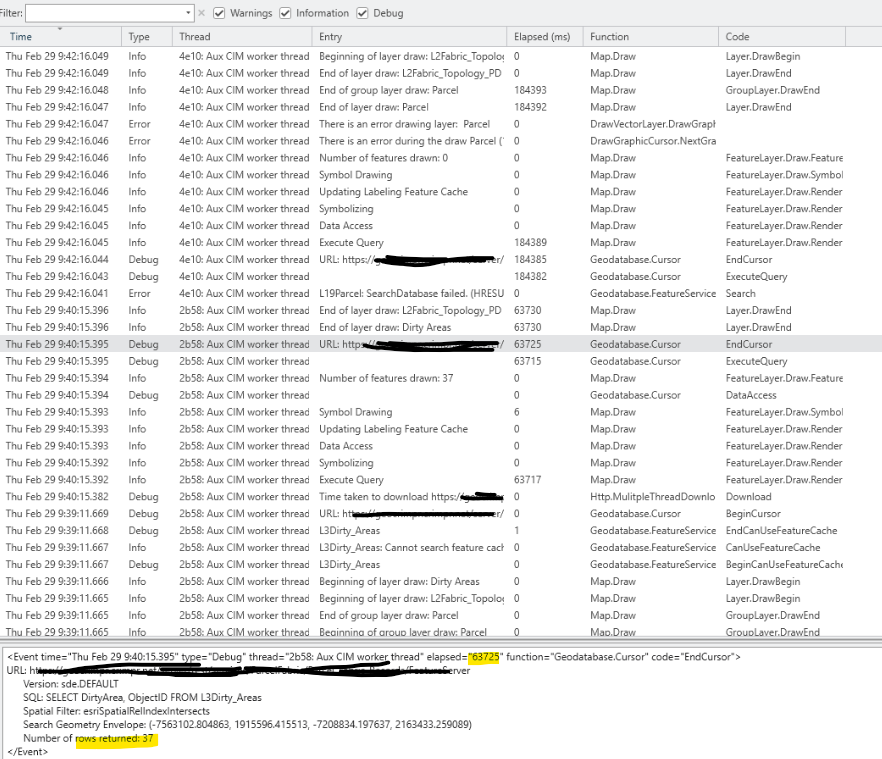
So my question is, why Dirty area layer has so bad performance, what could be the reason for this behavior.
Thanks,
Diego Llamas


- Mark as New
- Bookmark
- Subscribe to RSS Feed
- Permalink
How many rows are returned when you run the GetCount geoprocessing tool (or when you open the attribute table)? This is how many dirty areas are 'active' in your version.
How many rows are in the dirty areas table if you do a count statement directly against the table using SQL? This is the total number of active and historical records in your geodatabase.

- Mark as New
- Bookmark
- Subscribe to RSS Feed
- Permalink
Hi @RobertKrisher, we have in the Default version...
406,549 records when the tool ran or we open the attributes table.
411,808 records when using querying directly in the database.
Don't understand how so many records are still showing in the table since we validated and cleared everything during the weekend and as today just a few dirty areas are displaying when the layer is on. Stats in the tables are updated and indexes are rebuilt recently. As @DiegoLlamasOlivares mentioned performance is very poor for some reason.

- Mark as New
- Bookmark
- Subscribe to RSS Feed
- Permalink
Greetings
I just posted basically the same question:
Hoping to get some input from ESRI on this....the performance is terrible. We are running 11.5/3.6.
Thanks!
- Mark as New
- Bookmark
- Subscribe to RSS Feed
- Permalink
Statistics, indices, and the spatial index are the most common cause of performance issues with drawing that layer. Its also recommended to not draw that layer at small scales (when zoomed out) because of the limited usefulness of the layer when zoomed out and the potential performance hit (even once you've tuned it properly).
If you're having problems getting the tuning right, log a case with support.
- Mark as New
- Bookmark
- Subscribe to RSS Feed
- Permalink
Thanks. I've tried everything I can think of tuning-wise, vacuum settings, indexing (although there doesn't seem to be a way to index topology features?), analyzing, etc. It still takes minutes to validate and fix very simple errors. I have had a ticket on this for many months now about topology validation timing out and crashing with no resolution.
- Mark as New
- Bookmark
- Subscribe to RSS Feed
- Permalink
..as you can see from this video, it took five minutes to fix one very small error. Generally our parcel fabric performance is pretty good, fast redraws, snappy editing, etc. But when interacting with the topology it just crawls...
- Mark as New
- Bookmark
- Subscribe to RSS Feed
- Permalink
Have you tried deleting then recreating the spatial index on the layer?
- Mark as New
- Bookmark
- Subscribe to RSS Feed
- Permalink
Yes, it doesn't seem to help, still incredibly slow performance. I mentioned above that there doesn't seem to be a way to update the indexes of topology classes...I was referring to using Python to do it. The only way I can find is to manually do it by adding the topology to a new map and clicking the properties of each.
- Mark as New
- Bookmark
- Subscribe to RSS Feed
- Permalink
If you haven't already, log a case. With the number of rows you have in the dirty areas table it seems unusual that it would take that long to draw (unless you're drawing at full extent). In cases where I've seen this performance in the past (zoomed into 1:10k and getting a 3 minute draw time) it has been because the spatial index on the dirty areas layer had an unreasonable number.
