- Home
- :
- All Communities
- :
- Products
- :
- ArcGIS Online
- :
- ArcGIS Online Questions
- :
- Using Arcade to calculate change between values in...
- Subscribe to RSS Feed
- Mark Topic as New
- Mark Topic as Read
- Float this Topic for Current User
- Bookmark
- Subscribe
- Mute
- Printer Friendly Page
Using Arcade to calculate change between values in a Time Enabled layer
- Mark as New
- Bookmark
- Subscribe
- Mute
- Subscribe to RSS Feed
- Permalink
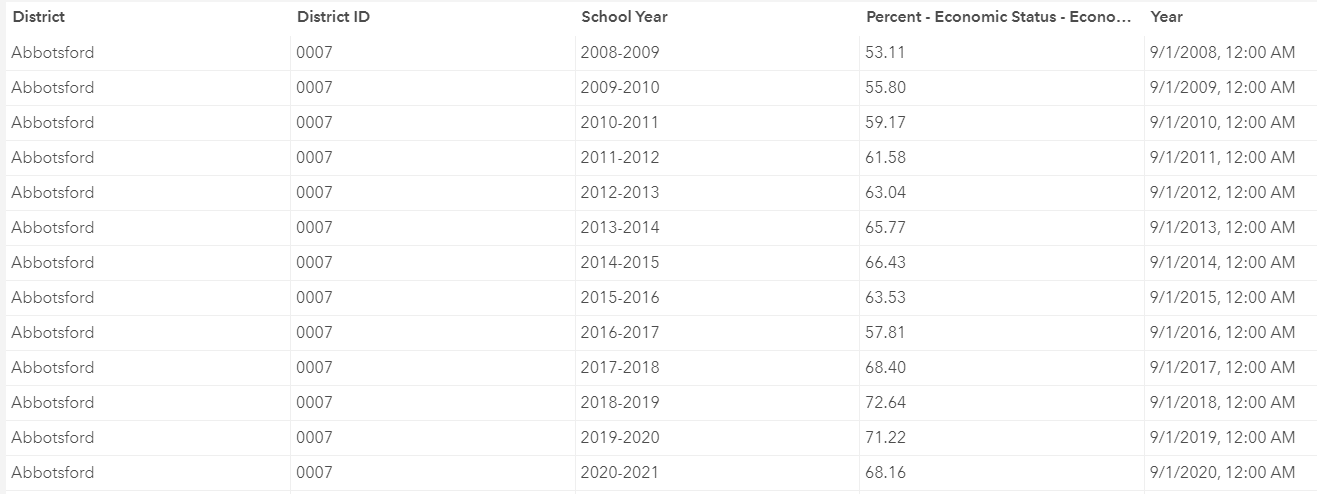
I have a time enabled layer containing school district enrollment demographics - this means that each feature (school district) has a row for each year's enrollment data. Last year, I got a request for my pop-ups to contain a change in percentage between the whichever year the time slider was on and the previous year. (e.g. 2018 = 72.64%, 2017 = 68.40%, and the percent change in the pop-up would display as 4.24%).
I have pretty basic programming skills so after a lot of searching for how to use Python to calculate new fields based on values in different rows, I threw the data in Excel, created the percent change fields, and joined them back to the data. Then I just included the appropriate percent change field in my pop-ups.
I would really love to be able to generate the percent change values using Arcade rather than adding 10 new fields. I'm pretty sure this can be done using Arcade. (Plus, then I'd also be able to calculate a percent change between the first and most recent school years!) I know that I need to use the FeatureSetByName with a Filter but I can't work out the code to return the values and do the calculation between years.
Since school years don't follow calendar years, I have two fields containing dates: a string School Year, and the actual date field Year (see attachment for sample of data for one feature/district).
Thanks in advance!
Solved! Go to Solution.
Accepted Solutions
- Mark as New
- Bookmark
- Subscribe
- Mute
- Subscribe to RSS Feed
- Permalink
I received some major help from someone at Esri during the UC.
var districtName = $feature.DISTRICT
var fSetByDistrict = OrderBy(Filter($layer, "DISTRICT = @districtName"),"YEAR asc")
var currentYear = Year($feature.Year)
var currentPercent = $feature["PCT_SWD"]
var dictYearCount = {}

//read the values into a dictionary and simplify the data
//get the year and the count to make math easier :)
for (var f in fSetByDistrict) {
    var yearKey = Text(Year(f.Year))
    var yearValue = f["PCT_SWD"]
    dictYearCount[yearKey] = yearValue
}

var activeYearCount = dictYearCount[Text(currentYear)]

if (HasKey(dictYearCount, Text(currentYear -1)) == true) {
    //check that there is data for the previous year
    var previousYearCount = dictYearCount[Text(currentYear -1)]
    var percentDiff = currentPercent - dictYearCount[Text(currentYear -1)]
    return "Enrollment for this student group changed by " + Round(percentDiff,2) + "% from the previous year."
} else {
    return ""
    //Don't show anything if there's no previous year to calculate a percent change.
}
Worked beautifully!