- Home
- :
- All Communities
- :
- Products
- :
- ArcGIS Online
- :
- ArcGIS Online Questions
- :
- Re: Unexpected results from Summarize Within
- Subscribe to RSS Feed
- Mark Topic as New
- Mark Topic as Read
- Float this Topic for Current User
- Bookmark
- Subscribe
- Mute
- Printer Friendly Page
- Mark as New
- Bookmark
- Subscribe
- Mute
- Subscribe to RSS Feed
- Permalink
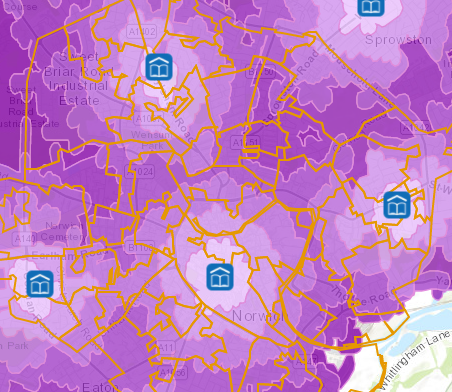
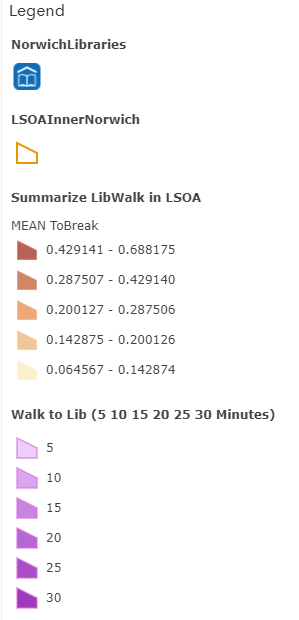
I've created a walk-time map in ArcGIS Online, based on library locations within a city, using 5-minute increments between 0-5 mins and 25-30 mins. The attribute table shows these are stored as whole minutes in two columns (for each end of the range) e.g. 25.00 and 30.00 - this is what I expect.
I then want to summarise this data by finding the mean travel time (travel time band End value) within ~60 census areas of the city. I do this with Summarize Within.
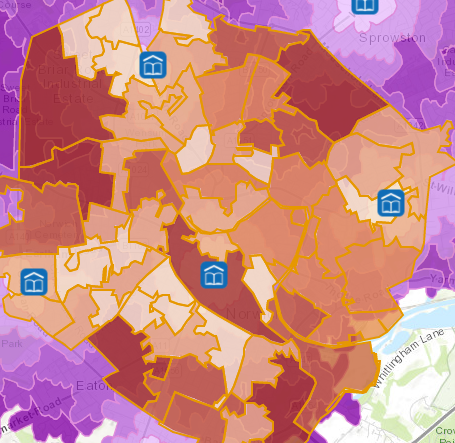
The tool runs, but the output has values that are all less than 0 (range 0.06 to 0.68). Given that the lowest possible travel time value is 5, and the census areas are totally covered by travel time areas, how can this be?
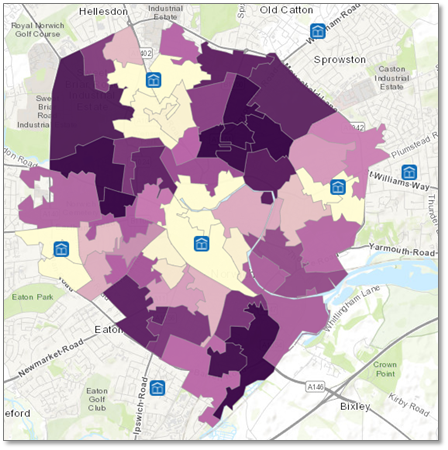
There are also unexpected patterns in the data, where a census area that contains a library (has low walking time) shows with a (relatively) high value. See the lower-central library in the maps below.
I'm trying to write this up for a student exercise but simply cannot explain these results! Can anyone help?
Edit: I tried the same operation but summarising distance buffers instead of walk time. I have the same issue. Buffer distances are 500 1000 1500 2000 but the highest average in the summarised dataset is ~30 (should be just under 1500). And again that central area shows an odd, too-high result.
Solved! Go to Solution.
Accepted Solutions
- Mark as New
- Bookmark
- Subscribe
- Mute
- Subscribe to RSS Feed
- Permalink
It is important to understand the help on this topic (Summarize Within—ArcGIS Online Help | ArcGIS ), because with the type of data you will not get the result you hope to obtain. Scroll down to the limitations:
Lines and areas are summarized using proportions; therefore, it is best to summarize absolute data (such as population) rather than relative data (such as average income) when lines or areas are being summarized.
If you look at the explanation further below you see a good example (the Area section in how it works):

The population value of the blue polygon is 4500, but only 3375 is used since the blue polygon only overlaps partially. In your case there is an additional reason for the values to be so small. Your drive time areas are dissolved. Look at the polygon indicated with the black outline from the example that you provided:
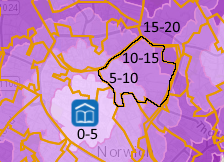
The polygon mainly overlaps the ranges: 5-10, 10-15 and 15-20. Since the fraction of the entire range polygons that it overlaps is so small, your values will be very low.
To get proper results you will probably need a Overlay Layers—ArcGIS Online Help | ArcGIS (Union) followed by some field calculations to get a weighted average, but if you have access to Desktop, it is easier to do it there.
- Mark as New
- Bookmark
- Subscribe
- Mute
- Subscribe to RSS Feed
- Permalink
the numbers look like mean + std deviations levels. ie mean to break range. Check the explanation to see if the actual times have been converted to those relative to the mean and std dev.
- Mark as New
- Bookmark
- Subscribe
- Mute
- Subscribe to RSS Feed
- Permalink
It is important to understand the help on this topic (Summarize Within—ArcGIS Online Help | ArcGIS ), because with the type of data you will not get the result you hope to obtain. Scroll down to the limitations:
Lines and areas are summarized using proportions; therefore, it is best to summarize absolute data (such as population) rather than relative data (such as average income) when lines or areas are being summarized.
If you look at the explanation further below you see a good example (the Area section in how it works):
The population value of the blue polygon is 4500, but only 3375 is used since the blue polygon only overlaps partially. In your case there is an additional reason for the values to be so small. Your drive time areas are dissolved. Look at the polygon indicated with the black outline from the example that you provided:
The polygon mainly overlaps the ranges: 5-10, 10-15 and 15-20. Since the fraction of the entire range polygons that it overlaps is so small, your values will be very low.
To get proper results you will probably need a Overlay Layers—ArcGIS Online Help | ArcGIS (Union) followed by some field calculations to get a weighted average, but if you have access to Desktop, it is easier to do it there.
- Mark as New
- Bookmark
- Subscribe
- Mute
- Subscribe to RSS Feed
- Permalink
Xander, thank you for a reply that was quick, clear and thorough!
Clearly I was working on this too late in the day. With fresh eyes it is clear that the operation would not work as I expected - I looked at the help a few times but evidently the relevant part passed me by.
I am working around it like this for now:
- add a new field TimeByArea and calculate it to be (WalkTimeLow + 2.5) * AreaSqKm
This gives the median value for the (5 minute) walk time band, multiplied up to give a dummy "total" value for the entire walk time band polygon. - Summarize Within to get the Sum TimeByArea for each census area
This works properly now that I have used the dummy "total" value. - add a new field AveWalkTime and calculate it to be SUM_TimeByArea / AreaSqKm
This is necessary to bring the values back to being walking time in minutes.
Results:
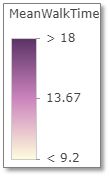
This looks much better. I did a double take at the legend, thinking the high values are too low, but the dark purple areas go up to values of 22, which is logical - they are just all lumped in to ">18". (It could be helpful if the legend indicated what the max value is.)
Thanks again! I can't express how helpful this response was. I hope my workaround is helpful to others in future. Since the calculations needed are actually pretty straightforward, it would be great if this could be incorporated into the tool, e.g. via a parameter allowing you to state if the data to be summarised are counts or not.
Katy
- Mark as New
- Bookmark
- Subscribe
- Mute
- Subscribe to RSS Feed
- Permalink
I see this has a bit of traffic. If you think this capability would be useful to have embedded in the tool, please vote at Ideas  https://community.esri.com/ideas/14325-allow-summarize-within-arcgis-online-to-use-non-count-data
- Mark as New
- Bookmark
- Subscribe
- Mute
- Subscribe to RSS Feed
- Permalink
In different words,
I found that the Summarize Within tool does not provide an area weighted mean within the target polygons. It doesn't do the 'within' part. If your 'input summary feature' polygons extend outside of the target 'input polygon', that is they intersect it but are not clipped, identitied, or unioned to it's boundaries, the tool with average in values from areas outside/greater than the target 'input polygon'. This will throw off the area weighted mean of values with the polygon.
The work around is to do union (as mentioned above) or identity between the 'input polygons' and the 'input summary features' before running the tool so there are no external areas intersecting the polygons you want the means from.
It seems like most users don't expect areas outside of a polygon to be included in the mean generated from a 'summarize within' tool. Perhaps this tool could be called 'Summarize Intersecting' tool. And after adding the identity/union step prior to analysis, the 'Summarize Within' tool could be updated to perform as expected.
If there are many users that expect this tool to include area outside the input polygon area, please disregard this suggestion.
- Mark as New
- Bookmark
- Subscribe
- Mute
- Subscribe to RSS Feed
- Permalink
As seen in Xander's explanation above, the documentation for Summarize Within shows that the values that are being summarized are calculated based on the proportion of the 'input summary feature' that falls within the 'summary polygon'.

So even though the population of the entire yellow region is 3200, we only want to summarize the amount that falls within Neighbourhood 1, so we multiply the ratio of the yellow region that falls within the bounding polygon by the population value (4/6 * 3200 = 2133) .
This of course assumes that the values can be divided, which is why we recommend using fields with counts and amounts rather than rates or ratios.
When we calculate the mean and standard deviation, we calculate an area-weighted mean and standard deviation of the five regions within Neighbourhood 1. Using area-weighting means that the regions that have more overlap will contribute more towards the mean.
To do this, we take the proportional values calculated above, and then weight them by the amount of the bounding polygon that they occupy. So, calculating the weighted mean for Neighbourhood 1 (which has 17 sq miles total area) would be done with this equation:

Therefore, the portion of the yellow region which falls outside Neighbourhood 1 doesn't contribute to the mean calculation, except in terms of determining the proportional value that will be used in summary statistic calculations (i.e. the calculation that led us to have a value of 2133 for yellow, instead of 3200).
@EdCarter is that proportional value calculation what you mean when you say "the areas outside of a polygon are included in the mean"?
Can you provide an example dataset/workflow that illustrates what you mean when you say "the tool [will] average in values from areas outside/greater than the target 'input polygon'"?
What would help to make the documentation more clear?
Thanks!
Amanda
Product Engineer, Web Analysis
Product Engineer - Web Analysis
- Mark as New
- Bookmark
- Subscribe
- Mute
- Subscribe to RSS Feed
- Permalink
Yes, the 'unexpected results' mentioned above is exactly what I was talking about.
In the example of population, the Summarize Within tool includes the full 3200 population rather than the 2133 that are actually 'within' the summarized area.
The work around for me is to clip the polygons to be summarized first and area weight the density values within the new boundaries, before running the tool. This seems like something that should be included in the Summarize Within tool from the beginning.
Review_____________
The Summarize Within tool is misleading in its name, because it summarizes intersecting polygons that fall partially outside of the summarized area. Calling the tool Summarize Within when it includes areas 'without' is very counter intuitive for a user not reading the fine print. I suggest renaming this tool, Summarize Intersecting.
I created a test dataset to confirm the tool was including intersecting areas outside of the polygon. That was part of support/cases/02852256.
Please let me know if this answers your question.
Ed Carter