- Home
- :
- All Communities
- :
- Products
- :
- ArcGIS Online
- :
- ArcGIS Online Questions
- :
- Re: Pop-ups don't respect scale-dependent data inv...
- Subscribe to RSS Feed
- Mark Topic as New
- Mark Topic as Read
- Float this Topic for Current User
- Bookmark
- Subscribe
- Mute
- Printer Friendly Page
Pop-ups don't respect scale-dependent data invisibility
- Mark as New
- Bookmark
- Subscribe
- Mute
- Subscribe to RSS Feed
- Permalink
I created an ArcGIS.com map with one dynamic map service which includes seven group layers for scale-dependent displays of symbology and labeling. I configured pop-ups for each data layer within each group layer. When I click on a feature symbol, regardless of what scale the map is on, I get seven identical results. So, it appears that the pop-ups are not respecting the invisibility of layers turned off by scale-dependence. This is not good behavior for users to see.
Is there a workaround for this which still allows scale-dependent mapping? Is this something that can be fixed?
Thanks,
Marc
- Mark as New
- Bookmark
- Subscribe
- Mute
- Subscribe to RSS Feed
- Permalink
Kevin,
The problem is that the point is not being displayed in the proper location. As you say, if you click to the left of the point, you can get the popup. This is actually where the point should be displaying, but it's not. The problem is with ArcGIS Server. Because you are accessing an image service on ArcGIS Server, ArcGIS Online sends a request to the server to get the image. Here's the request that gets sent:
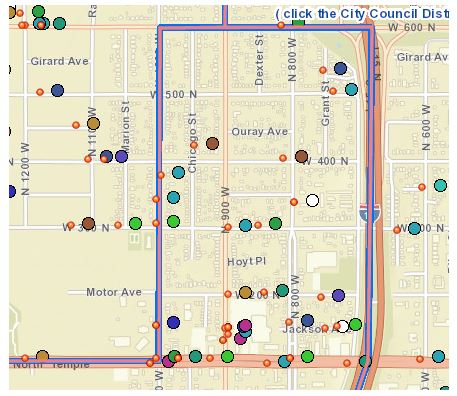
If you click this link, you'll get this image back:
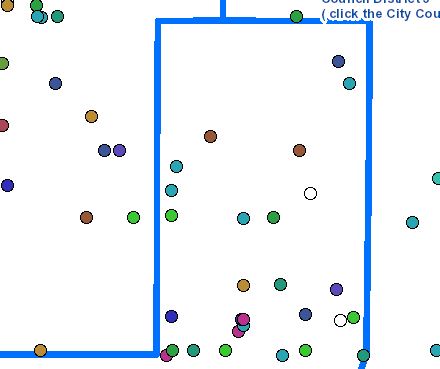
I added the same layer a different way in ArcGIS Online, on top of your original. Notice that the orange point (the ones I added) are shifted left. Strangely, the polygon outlines are not shifted, so this seems to be a problem specific to point layers. The reason you were able to get the popup to display when zoomed out is because of the scale difference. At smaller scales, the point falls within the popup search tolerance to find it.
So what are your options to get to get this to display correctly.
- It appears that you work for the city, and thus might have some control over ArcGIS Server. You can upgrade your server and see if that fixes the problem. This is a pretty specific problem, so I'm not sure if anyone has noticed before. I believe it has to do with transforming the data from EPSG: 32043 to EPSG: 3857. The only way to know for sure would be to test it out.
- You could republish your data in EPSG: 3857. This would mean ArcGIS Server wouldn't have to transform the data to display in ArcGIS Online. However, you may still encounter the same problem, because your data would have to be transformed into that spatial reference by ArcMap (by setting the coordinate system on the data frame) when publishing to ArcGIS Server. But you would know immediately by just setting the coordinate system in ArcMap, I believe.
- You can add the layer like I did above, by directly targeting the sub-layer in the map service. Add it to the map as a layer on the web using this URL: Layer: Crimes in the past 10 days (ID: 0). One limitation with this approach is that there are too many points to display when zoomed out fully, and you'll need to set scale dependencies on the layer so that the points don't display when zoomed out. Drawing the layer in this manner bypasses the image generation of the server and instead requests the actual geometry of the points. The browser then draws these points as graphics. The limitation is due to the fact that the browser can only draw so many graphics, thus you have to set scale visibility appropriately. Also different browsers have different abilities in terms of how many graphics they can draw.
Hope this helps,
Mike
- Mark as New
- Bookmark
- Subscribe
- Mute
- Subscribe to RSS Feed
- Permalink
it all gets built up with a python script at night, so adding a line to reproject it would be trivial. I need your personal phone number for great answers like these!
- Mark as New
- Bookmark
- Subscribe
- Mute
- Subscribe to RSS Feed
- Permalink
There's definitely something strange going on. I can add your map service to ArcMap and apply a different coordinate system to the data frame and see the same shift.
Do you know where the correct location of the points should be?? Added directly to ArcMap, without applying a different coordinate system, the points are positioned as the orange points in my figure above. My assumption is that is the correct geographic position.
What coordinate system is the original data in? Is it all in NAD 1927 State Plane Utah Central? Is it mixed, some NAD 83? Would you be willing to share your data so we can test it out? I am not a coordinate system expert, so I'm cc'ing one here... Melita Kennedy
Thanks,
Mike
- Mark as New
- Bookmark
- Subscribe
- Mute
- Subscribe to RSS Feed
- Permalink
these are the NAD 27 that you mention, but they come from xy's from a proprietary system. I build the points from a flat table of xy's.
My server is a bit screwy and I'm going to upgrade really soon. I can send some sample data if you give me an email!
- Mark as New
- Bookmark
- Subscribe
- Mute
- Subscribe to RSS Feed
- Permalink
Hi Kevin,
If you could send a few points to me, that would be great. My email at esri dot com is mkennedy.
So your other data in the service is also using NAD27 or is it in NAD83?
Thanks,
Melita
- Mark as New
- Bookmark
- Subscribe
- Mute
- Subscribe to RSS Feed
- Permalink
It would be very helpful to be able to set the scale dependency for popups. For example my viewer SAGIS Property Map Viewer has the county outline. I do not want the popup from it, ever. Now, I set it to stop drawing after zooming in to City scale. But I wish I could tell the popup not to fire unless it was out past a certain scale. Please consider adding this to ArcGIS Online and web maps.
- « Previous
-
- 1
- 2
- Next »
- « Previous
-
- 1
- 2
- Next »