- Home
- :
- All Communities
- :
- Products
- :
- ArcGIS Online
- :
- ArcGIS Online Questions
- :
- Labels not Drawing for Heat Mapping Style in Map V...
- Subscribe to RSS Feed
- Mark Topic as New
- Mark Topic as Read
- Float this Topic for Current User
- Bookmark
- Subscribe
- Mute
- Printer Friendly Page
Labels not Drawing for Heat Mapping Style in Map Viewer
- Mark as New
- Bookmark
- Subscribe
- Mute
- Subscribe to RSS Feed
- Permalink
Hi there,
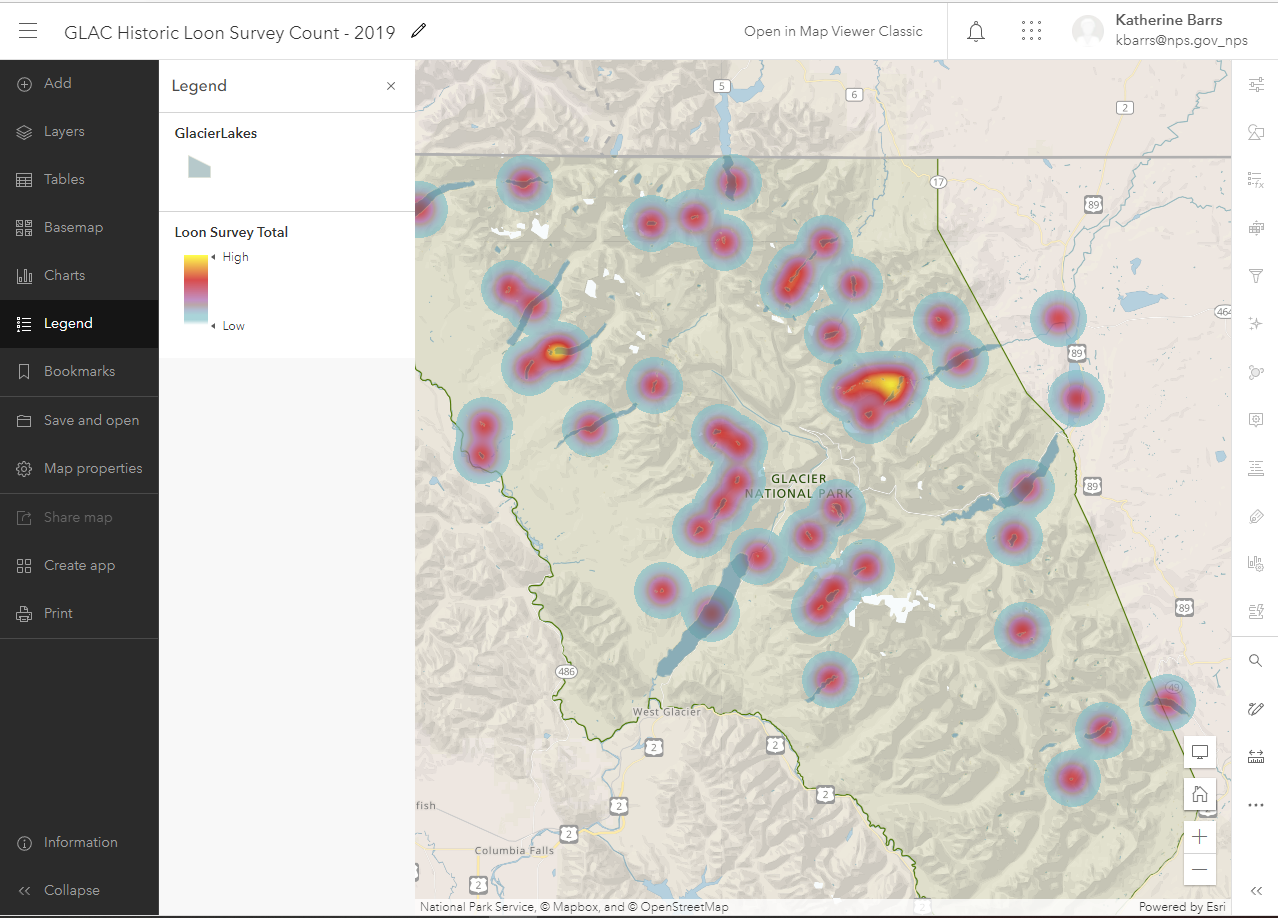
I'm working to update a StoryMap. I have a heat map labelled with the field, survey counts, that works perfectly in Map Viewer Classic. However, the labels do not work in the new version of Map Viewer. I've tried creating a new web map, toggling enable labels, and labelling with a different field name. The other types of styles (color and size) will allow the field, survey counts, to draw labels. Just not the heat mapping style.
Please see the attached screenshots of the error.
Has anyone else experienced this issue or know how to solve it?
Thank you in advance!
- Mark as New
- Bookmark
- Subscribe
- Mute
- Subscribe to RSS Feed
- Permalink
Looking into this but also wondering why not use clustering with labels to show the counts within the cluster? thanks!
- Mark as New
- Bookmark
- Subscribe
- Mute
- Subscribe to RSS Feed
- Permalink
Hi Russell @RussRoberts ,
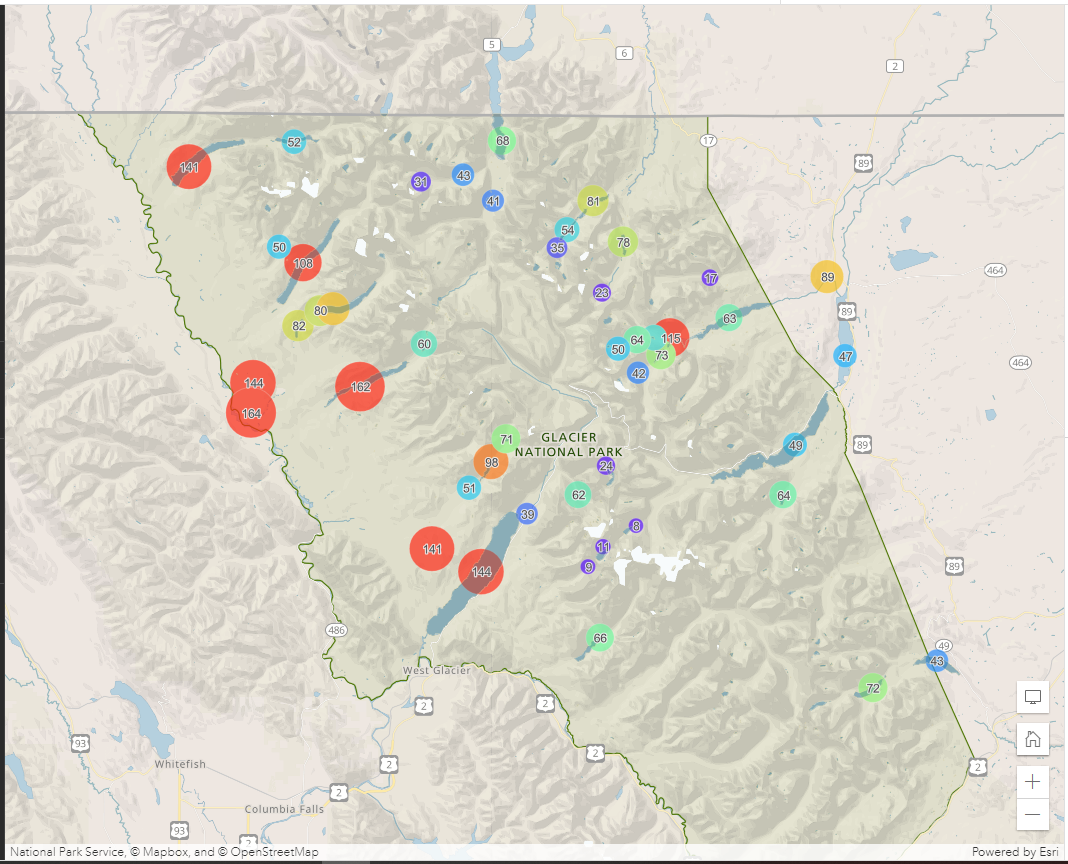
Thank you for the suggestion. I tried clustering with labels. The information I want to communicate is how many surveys were conducted at certain lakes (points) while also highlighting through heat mapping how some areas are surveyed more heavily than others. I can't seem to combine heat mapping and clustering. I also want to label all the lakes with their survey counts rather than labelling a cluster. I did obtain a similar result to the original labelled heat map with using the style "color and size" and modifying the symbol style to more closely match a heat map color scheme. I'd still love to recreate the original map in Map Viewer with heat mapping and labelling.
Thank you for any information you can provide.