- Home
- :
- All Communities
- :
- Products
- :
- ArcGIS Online
- :
- ArcGIS Online Questions
- :
- How do I display daily temperatures for one locati...
- Subscribe to RSS Feed
- Mark Topic as New
- Mark Topic as Read
- Float this Topic for Current User
- Bookmark
- Subscribe
- Mute
- Printer Friendly Page
How do I display daily temperatures for one location with time scale?
- Mark as New
- Bookmark
- Subscribe
- Mute
- Subscribe to RSS Feed
- Permalink
I am doing a project that is about specific heat waves that have occurred in the past. I need to plot these points on a map and I am hoping that I can insert the daily maximum temperatures over one month to show how they significantly increase in this specific area. How do I create a time scale/slider for this information?
- Mark as New
- Bookmark
- Subscribe
- Mute
- Subscribe to RSS Feed
- Permalink
Yo could have multiple points at the same location (one for each day) and enable time on the layer when you publish the data.
- Mark as New
- Bookmark
- Subscribe
- Mute
- Subscribe to RSS Feed
- Permalink
Where do I enable the time for the layer?
- Mark as New
- Bookmark
- Subscribe
- Mute
- Subscribe to RSS Feed
- Permalink
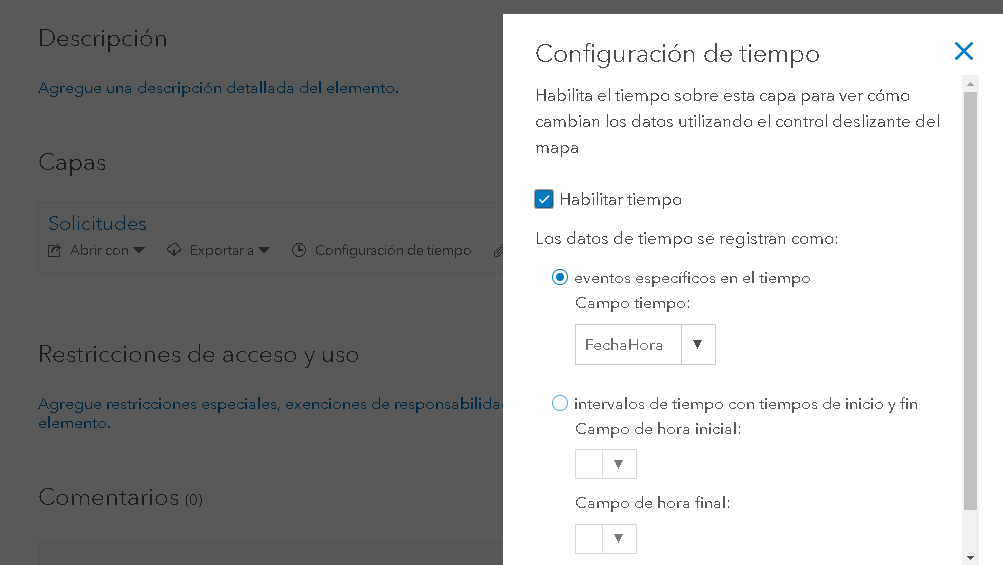
There are several ways to do this:
In ArcGIS Online, go to the item page of the layer and click on "Configure Time" and switch on the option "Enable Time": (sorry for the Spanish interface)
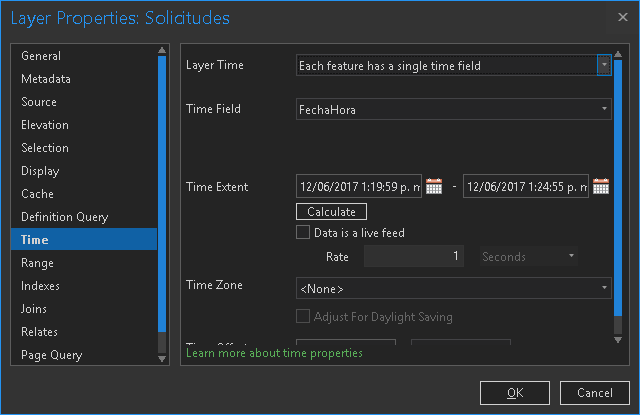
In ArcMap:

In ArcGIS Pro:
- Mark as New
- Bookmark
- Subscribe
- Mute
- Subscribe to RSS Feed
- Permalink
OK if I move this to https://community.esri.com/community/gis/web-gis/arcgisonline?sr=search&searchId=1723deae-9e73-4a67-... which is better place for this thread.
Rupert
- Mark as New
- Bookmark
- Subscribe
- Mute
- Subscribe to RSS Feed
- Permalink
Thanks Rupert!
Check out these blogs about creating and using time data in ArcGIS Online:
Using the Time Aware configurable app template | ArcGIS Blog
Showing Time in Story Maps | ArcGIS Blog
-Kelly