- Home
- :
- All Communities
- :
- Products
- :
- ArcGIS Online
- :
- ArcGIS Online Questions
- :
- Re: Dashboard Charts Slow to Load
- Subscribe to RSS Feed
- Mark Topic as New
- Mark Topic as Read
- Float this Topic for Current User
- Bookmark
- Subscribe
- Mute
- Printer Friendly Page
Dashboard Charts Slow to Load
- Mark as New
- Bookmark
- Subscribe
- Mute
- Subscribe to RSS Feed
- Permalink
I have noticed since the last update to ArcGIS Online that any of our dashboards that have charts, the charts are extremely slow to load, to the point that some of the dashboards become unresponsive and crash. This is especially true if there are multiple charts within the dashboard.
Has anyone else noticed this since the Summer 2024 AGO update?
- Mark as New
- Bookmark
- Subscribe
- Mute
- Subscribe to RSS Feed
- Permalink
Hi @mpboyle ,
I haven't experienced a slow down as of yet, but how many charts do your dashboards have, and what type? I usually only have one line chart and a few pie charts. Also what browser are you using? I've had Chrome go crazy after updates before, but I'm currently on Firefox. I'd recommend testing a few browsers if you haven't already.
- Mark as New
- Bookmark
- Subscribe
- Mute
- Subscribe to RSS Feed
- Permalink
The dashboards that are noticeable have 6 line charts. These all loaded in an acceptable time prior to the last AGO update. There is now a very noticeable delay in the charts loading. We are limited to using Edge at work, however I tested Chrome on my personal machine and the delay is still noticeable.
- Mark as New
- Bookmark
- Subscribe
- Mute
- Subscribe to RSS Feed
- Permalink
Hey @mpboyle,
Great troubleshooting questions above, I would like to know as well:
- When looking at network traffic inside your browser (chrome) what is the response time of the data being loaded in? (Please capture the full traffic of loading the dashboard and see if the crash / unresponsiveness will show any errors. Capture screenshot the errors if possible)
- How large of dataset are you displaying inside the chart? (how many data points)
Thanks,
- Koen
- Mark as New
- Bookmark
- Subscribe
- Mute
- Subscribe to RSS Feed
- Permalink
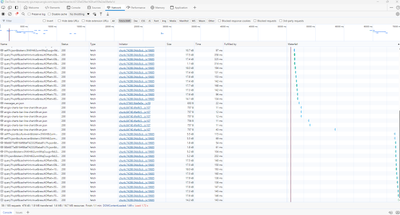
I'm not sure what all you want to see in the network traffic. The fetch statements don't seem to be taking terribly long. All Status values equal 200. Below is the network traffic with only fetch types showing.
There are approximately 62,000 data points in the source hosted feature layer, but not all are used in the charts. The charts are powered by a dynamically created feature set using Arcade and are refreshed every 1 minute.
As mentioned, prior to the update the charts loaded without issue, and I actually had the dynamic feature sets refreshing every 30 seconds without a problem. I bumped the refresh rate of the feature sets to 1 minute hoping that would help, but it doesn't seem to.
I thought maybe retrieving the data is an issue, but if I test the Arcade expression, data is returned quickly, even though it's only the first 100 features.
- Mark as New
- Bookmark
- Subscribe
- Mute
- Subscribe to RSS Feed
- Permalink
@Koen
Coming back to this issue...
I have created 2 dashboards that use the same AGO hosted feature layer. One dashboard is in AGO, one is in our Portal (11.2). Each one of these dashboards is configured the same way, using the same feature layer.
When opening the dashboards, please note how slow the AGO one is to load. It takes several minutes for the dashboard to load the charts and be able to switch between the tabs.
The one in our Portal loads almost instantly and you can cycle between the tabs right away.
The AGO dashboard become extremely slow after the last AGO update.
- Mark as New
- Bookmark
- Subscribe
- Mute
- Subscribe to RSS Feed
- Permalink
I experience the same slowdown since the update, to the point that some of our old Dashboard became impossible to use.
I noticed two different things :
- The graphs are slower to load, dashboards sometime freeze or crash
- When applying some filters on graphs they take a long time to rescale (before the update it was instant)
