- Home
- :
- All Communities
- :
- Products
- :
- ArcGIS Online
- :
- ArcGIS Online Questions
- :
- Re: Arcade Expression - intersecting feature sets ...
- Subscribe to RSS Feed
- Mark Topic as New
- Mark Topic as Read
- Float this Topic for Current User
- Bookmark
- Subscribe
- Mute
- Printer Friendly Page
Arcade Expression - intersecting feature sets with overlapping/split attribute options
- Mark as New
- Bookmark
- Subscribe
- Mute
- Subscribe to RSS Feed
- Permalink
Here is what I have so far:
var intersectLayer =Intersects(FeatureSetByName($map,"PC FPs nonTidal Regulated"), $feature)
var Hazard = "";
for (var f in intersectLayer) {
if (Hazard == "") {
Hazard = f.PC_FHA
} else {
Hazard += " And " + f.PC_FHA;
}
}
return Hazard
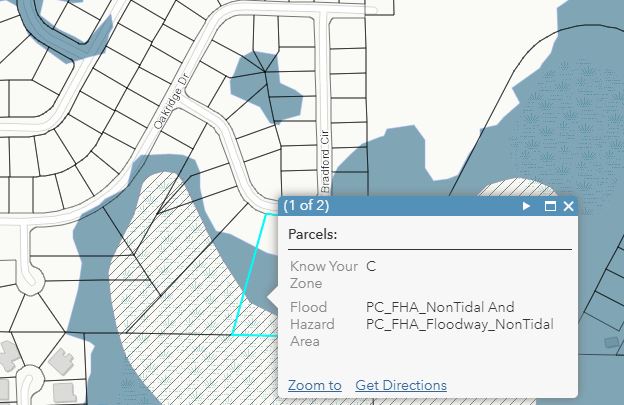
What I am looking for next is when there's a parcel that intersects both PC_FHA_NonTidal And PC_FHA_Floodway_NonTidal, I want it to return the option with a higher risk for instance PC_FHA_NonTidal. The parcel referenced is within both areas (hatched and blue symbology) and I want to default to the higher risk flood answer (whatever it ends up being- this is for proof of concept at this stage). The end goal is to have all the risk layer intersections added to the parcel layer for customers to find out information but I am stuck when there are multiple options for a specific parcel boundaries. The popup will end up being very similar to the floodplain inquiry solution but more specific parameters because I want to default to a specific answer when multiple intersecting options are found. Does that make sense? Thank you!
Solved! Go to Solution.
Accepted Solutions
- Mark as New
- Bookmark
- Subscribe
- Mute
- Subscribe to RSS Feed
- Permalink
Hi Allison Goldberg ,
To provide you with an example, see the expression below:
// dictionary with PC_FHA values and the corresponding risk
var risks = {"PC_FHA_NonTidal": 1,
"PC_FHA_Floodway_NonTidal": 2,
"PC_FHA_SomeOtherValue": 3};
// intersect the feature and get the couny
var intersectLayer =Intersects(FeatureSetByName($map,"PC FPs nonTidal Regulated"), $feature);
var cnt = Count(intersectLayer);
// start the analysis
var highest_risk = 0;
var risk_class = "";
var result = "";
if (cnt > 0) {
for (var f in intersectLayer) {
var description = f.PC_FHA;
if (HasKey(risks, description)) {
// PC_FHA is in risk dictionary
var risk = risks[description];
if (risk > highest_risk) {
// higher risk found
higest_risk = risk;
risk_class = description;
}
} else {
// the PC_FHA is not in the risk dictionary, skip value?
}
}
result = "Flood risk: " + risk_class + " (" + highest_risk + ")";
} else {
result = "No risk detected"
}
return result;Some explanation:
- on lines 2-4 a dictionary is created to provide a risk value for each PC_FHA value (this is an example and you should define your own)
- on line 7 the intersect is carried out and line 8 will determine the number of intersecting polygons
- on lines 11 - 13 some initial values are defined
- on line 14 the analysis is started, but we will only want to do this in case with have intersecting flood polygons (cnt>0)
- on line 17 a validation takes place to see if the PC_FHA value is in the risk dictionary (make sure it is)
- on line 19 it will get the corresponding risk value based on the PC_FHA value (description)
- lines 20 - 23 will see if the risk of the current polygon is higher than the highest value and if so the highest risk and description (class) are updated.
- At the end on line 29 the resulting text (highest risk class) will be created and this is returned on line 34
You could potentially extend this to create a multiline output that will indicate the list of risks and their corresponding overlap percentage with the parcel.
- Mark as New
- Bookmark
- Subscribe
- Mute
- Subscribe to RSS Feed
- Permalink
Hi Allison Goldberg ,
Thanks for branching your question. It makes sense what you are saying, but in order to determine the highest risk, you will need to use some sort of dictionary of the possible PC_FHA value and the risk level. Do you have such a table?
- Mark as New
- Bookmark
- Subscribe
- Mute
- Subscribe to RSS Feed
- Permalink
Hello Xander Bakker
Thanks for your response. I don't have the dictionary or "key" from the customer yet on the different hazards and zones but if I provide you with a hypothetical one, would that work? For instance, say the possible options for PC_FHA values are A, B, C, D, and E zones. With zone A hypothetically being the lowest risk and zone E as the highest...or a score from 1-5 with A=1 risk (lowest risk), then B=2 (moderate), then C=3 (slightly more moderate), then D=4 (higher risk), and E=5 (highest risk potential). Let's say the parcel shown above is split between Zone B and Zone D, I would then want the expression to only showcase D. Does that help you formulate the language?
- Mark as New
- Bookmark
- Subscribe
- Mute
- Subscribe to RSS Feed
- Permalink
Hi Allison Goldberg ,
To provide you with an example, see the expression below:
// dictionary with PC_FHA values and the corresponding risk
var risks = {"PC_FHA_NonTidal": 1,
"PC_FHA_Floodway_NonTidal": 2,
"PC_FHA_SomeOtherValue": 3};
// intersect the feature and get the couny
var intersectLayer =Intersects(FeatureSetByName($map,"PC FPs nonTidal Regulated"), $feature);
var cnt = Count(intersectLayer);
// start the analysis
var highest_risk = 0;
var risk_class = "";
var result = "";
if (cnt > 0) {
for (var f in intersectLayer) {
var description = f.PC_FHA;
if (HasKey(risks, description)) {
// PC_FHA is in risk dictionary
var risk = risks[description];
if (risk > highest_risk) {
// higher risk found
higest_risk = risk;
risk_class = description;
}
} else {
// the PC_FHA is not in the risk dictionary, skip value?
}
}
result = "Flood risk: " + risk_class + " (" + highest_risk + ")";
} else {
result = "No risk detected"
}
return result;Some explanation:
- on lines 2-4 a dictionary is created to provide a risk value for each PC_FHA value (this is an example and you should define your own)
- on line 7 the intersect is carried out and line 8 will determine the number of intersecting polygons
- on lines 11 - 13 some initial values are defined
- on line 14 the analysis is started, but we will only want to do this in case with have intersecting flood polygons (cnt>0)
- on line 17 a validation takes place to see if the PC_FHA value is in the risk dictionary (make sure it is)
- on line 19 it will get the corresponding risk value based on the PC_FHA value (description)
- lines 20 - 23 will see if the risk of the current polygon is higher than the highest value and if so the highest risk and description (class) are updated.
- At the end on line 29 the resulting text (highest risk class) will be created and this is returned on line 34
You could potentially extend this to create a multiline output that will indicate the list of risks and their corresponding overlap percentage with the parcel.
- Mark as New
- Bookmark
- Subscribe
- Mute
- Subscribe to RSS Feed
- Permalink
This is really thorough, thanks Xander Bakker. When I tried inputting the new attribute expression (called Highest Risk Test) in the webmap it didn't work (just removed third option to mimic scenario) and the output is blank. I know this is just an example but it should've mimicked it. I have a group created in our AGOL, can I add you to it to take a look at the data in context?
- Mark as New
- Bookmark
- Subscribe
- Mute
- Subscribe to RSS Feed
- Permalink
Hi Allison Goldberg ,
Sure, that would be better. Things always become a more understandable if one can have a look at the data. You can invite me using my AGOL user "xbakker.spx".
Thanks!
- Mark as New
- Bookmark
- Subscribe
- Mute
- Subscribe to RSS Feed
- Permalink
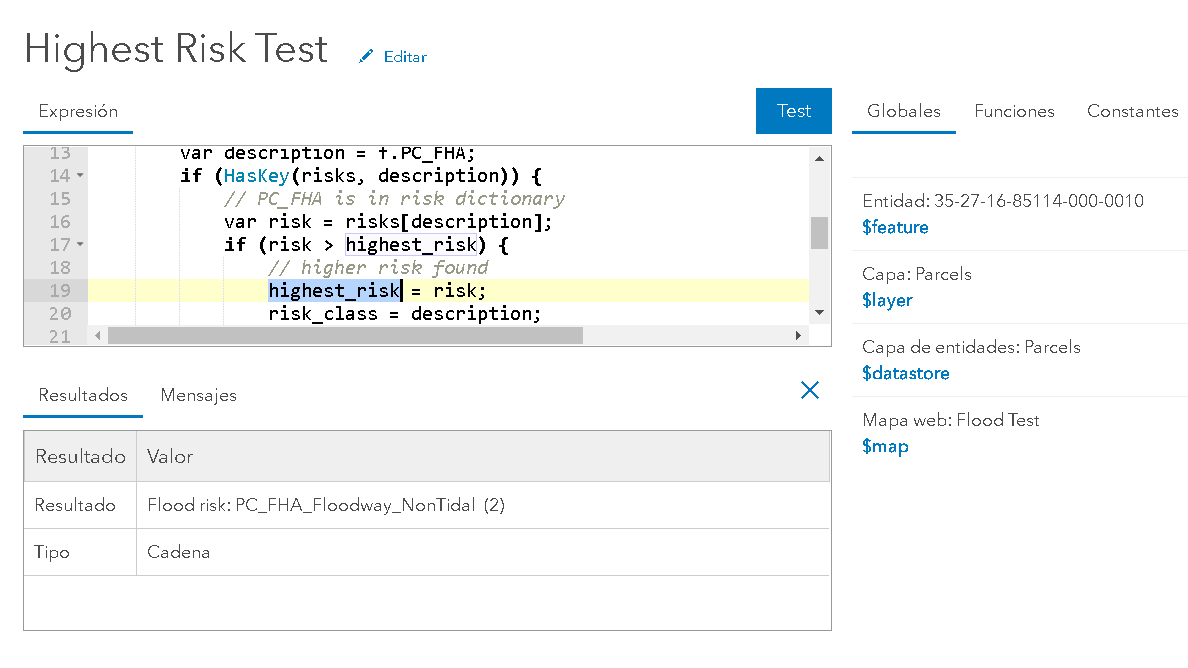
I just had a look at the expression called "Highest Risk Test" and I had a typo at line 19 (see the blue marked text). After correcting the variable name (adding an "h") it seems to work:
- Mark as New
- Bookmark
- Subscribe
- Mute
- Subscribe to RSS Feed
- Permalink
Thanks so much, Xander Bakker. This is exactly what I was looking for in terms of proof of concept. I really appreciate all your assistance. The process makes sense now. Thank you.
- Mark as New
- Bookmark
- Subscribe
- Mute
- Subscribe to RSS Feed
- Permalink
You're welcome. I'm glad it works!
- Mark as New
- Bookmark
- Subscribe
- Mute
- Subscribe to RSS Feed
- Permalink
Just to provide you with another example, here is a way you can show more info. I used the FEMA layer as example, but since it has complex multipart polygons, it is pretty slow:
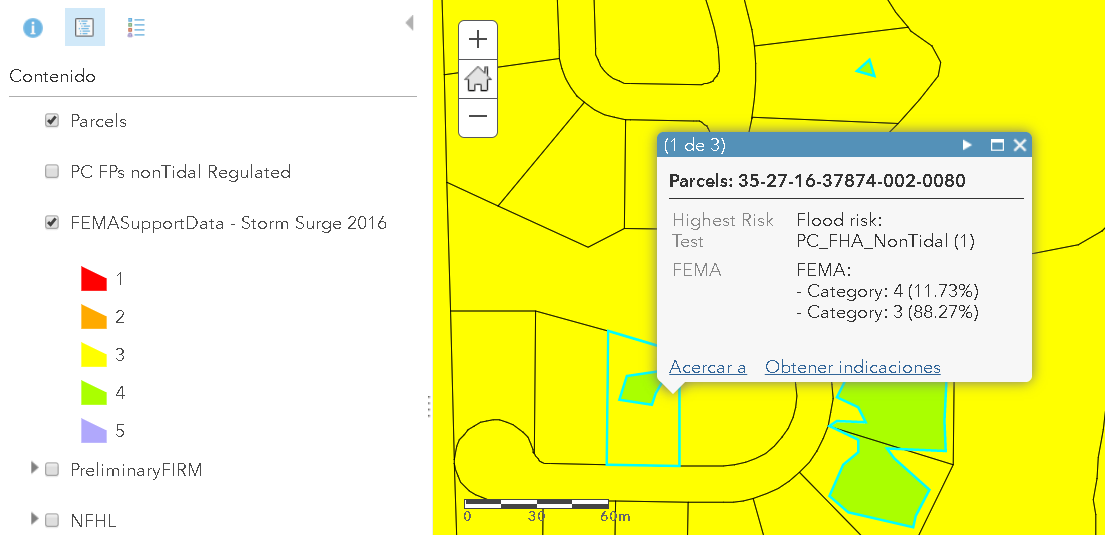
In this case it list the percentage of overlap of the different categories in the parcel. The expression used is:
var FEMA = OrderBy(Intersects($feature, FeatureSetByName($map,"FEMASupportData - Storm Surge 2016")), "CATEGORY DES");
var cnt = Count(FEMA);
var parcelarea = AreaGeodetic($feature, "square-feet");
var result = "FEMA:";
if (cnt > 0) {
for (var FEMApol in FEMA) {
var intersectarea = AreaGeodetic(Intersection($feature, FEMApol), "square-feet");
var category = FEMApol.CATEGORY;
var percentage = (intersectarea * 100.0) / parcelarea;
result += TextFormatting.NewLine + " - Category: " + category + " (" + Round(percentage, 2) + "%)";
}
} else {
result = "No risk detected";
}
return result;There is a thing that is not working very well in this demo expression... when you have several polygons of the same FEMA category in one parcel you will have multiple lines. This can be avoided adjusting the expression. If you want to know how, just let me know and I can adjust the example.