- Home
- :
- All Communities
- :
- Products
- :
- ArcGIS Online
- :
- ArcGIS Online Questions
- :
- Re: AGOL Print - Basic Viewer Template
- Subscribe to RSS Feed
- Mark Topic as New
- Mark Topic as Read
- Float this Topic for Current User
- Bookmark
- Subscribe
- Mute
- Printer Friendly Page
- Mark as New
- Bookmark
- Subscribe
- Mute
- Subscribe to RSS Feed
- Permalink
Hi All,
I am in the process of transitioning a few flex viewer web apps over to AGOL web apps. I have everything working except the print functionality. I have seen several posts that have had problems but no resolutions. When I replace the default print task with my print task on our ArcGIS Server that works in the flex viewer apps, I get not results and no errors. The print templates I have to choose from are still those associated with the default Esri print service. When I choose one of those templates, the print button changes to say "Printing" for a short period, then it changes back to "Print", no link to get my printout.
I am using a print task created using this tutorial (which works in my flex app).
Thanks,
Jeff Ward
Summit County GIS
Summit County, Utah
Solved! Go to Solution.
- Mark as New
- Bookmark
- Subscribe
- Mute
- Subscribe to RSS Feed
- Permalink
Sorry, it does show imagery until you zoom to the lowest scale level, then just the operational layers.
Summit County, Utah
- Mark as New
- Bookmark
- Subscribe
- Mute
- Subscribe to RSS Feed
- Permalink
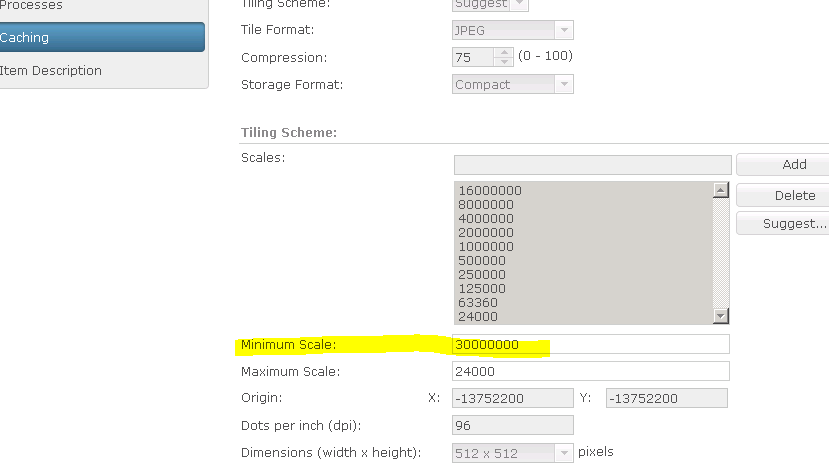
Jeff, I had a similar thing happen yesterday where my basemap/image would display at full scale, but when I tried to print, only operational layers would show. For me, I had to go back to my basemap ArcGIS Server service and change the "minimum scale" in my case. I did this in ArcGIS Server Manager, selecting properties for the service I was having issues with. This is a custom and cached/tiled basemap, tiled from 1:16m to 1:24k.
In manager, I was allowed to change the "minimum scale" to 30m. I saved and refreshed the service. That seems to have fixed it for me. I was not able to find this in Catalog (their it was "minimum cached scale" , not "minimum scale")
I'm not sure that this is the way it should work, but it did. My guess is that since my cache was set to 1:16,000,000 and displayed correctly, when I when to print is was attempting to get different tile scale and was then blank. For my immediate purposes of testing printing with custom templates and geopdf, that's what I needed. I'll be messing with it more myself in the future.
Hope this helps giveyou some ideas to try.
- Mark as New
- Bookmark
- Subscribe
- Mute
- Subscribe to RSS Feed
- Permalink
Thanks for the input Rebecca Strauch. The cached service I am using is the Esri imagery service, so I don't have control over the tiles.
Summit County, Utah
- Mark as New
- Bookmark
- Subscribe
- Mute
- Subscribe to RSS Feed
- Permalink
I zoomed in as far as possible and was still able to get the imagery to print. Do you have the same issue using the out of the box print service or is it only reproducible with your custom service?
- Mark as New
- Bookmark
- Subscribe
- Mute
- Subscribe to RSS Feed
- Permalink
It is just my custom print service. It works with the default print service, but not my own. Is there a setting I need to change in my print service? I like my printouts to have a disclaimer and other custom stuff associated with my own layouts.
Summit County, Utah
- Mark as New
- Bookmark
- Subscribe
- Mute
- Subscribe to RSS Feed
- Permalink
The imagery exports if I choose the MAP_ONLY option, but all of my other layouts won't export the lowest level of imagery.
Summit County, Utah
- Mark as New
- Bookmark
- Subscribe
- Mute
- Subscribe to RSS Feed
- Permalink
Jeff I just ran a quick test using the rest Services directory for your print service and can reproduce the issue with the imagery not printing. Perhaps there is something that needs to be updated on the service. Maybe try posting this question in the ArcGIS Server space?
Here are my test steps:
1. Go to the REST services directory for your service: Execute Task (Export Web Map)
2. Enter pdf for Format
3. Enter 11 x 17 Portrait for Layout Template
4. Enter the following for Web Map as JSON
{"mapOptions":{"showAttribution":true,"extent":{"xmin":-12015578.141286803,"ymin":4659919.495362616,"xmax":-12015131.462402897,"ymax":4660042.511204976,"spatialReference":{"wkid":102100}},"spatialReference":{"wkid":102100},"scale":1128.4971760040912},"operationalLayers":[{"id":"layer1","title":"layer1","opacity":1,"minScale":591657527.591555,"maxScale":1128.497176,"url":"http://services.arcgisonline.com/ArcGIS/rest/services/World_Imagery/MapServer"},{"id":"Weather_Warnings_Watches_Advisories_Statements_7721","title":"Weather_Warnings_Watches_Advisories_Statements_7721","opacity":0.29000000000000004,"minScale":50000000,"maxScale":1500000,"url":"http://tmservices1.esri.com/arcgis/rest/services/LiveFeeds/Weather_Warnings_Watches_Advisories_State...","layers":[{"id":0,"layerDefinition":{"source":{"type":"mapLayer","mapLayerId":0},"definitionExpression":"EVENT = 'Red Flag Warning'"}}]},{"id":"NOAA_METAR_current_wind_speed_direction_6464","title":"NOAA_METAR_current_wind_speed_direction_6464","opacity":1,"minScale":0,"maxScale":0,"url":"http://tmservices1.esri.com/arcgis/rest/services/LiveFeeds/NOAA_METAR_current_wind_speed_direction/M...","layers":[{"id":0,"layerDefinition":{"source":{"type":"mapLayer","mapLayerId":0}}}]},{"id":"MODIS_Thermal_9833","title":"MODIS_Thermal_9833","opacity":0.73,"minScale":0,"maxScale":72223,"url":"http://tmservices1.esri.com/arcgis/rest/services/LiveFeeds/MODIS_Thermal/MapServer","layers":[{"id":0,"layerDefinition":{"source":{"type":"mapLayer","mapLayerId":0}}}]},{"id":"Wildfire_Activity_3790","title":"Wildfire_Activity_3790","opacity":0.78,"minScale":0,"maxScale":0,"url":"http://tmservices1.esri.com/arcgis/rest/services/LiveFeeds/Wildfire_Activity/MapServer","layers":[{"id":0,"layerDefinition":{"source":{"type":"mapLayer","mapLayerId":0}}},{"id":1,"layerDefinition":{"source":{"type":"mapLayer","mapLayerId":1}}},{"id":3,"layerDefinition":{"source":{"type":"mapLayer","mapLayerId":3}}}]},{"id":"mapDiv_graphics","opacity":1,"minScale":0,"maxScale":0,"featureCollection":{"layers":[]}}],"exportOptions":{"outputSize":[800,1100],"dpi":96},"layoutOptions":{"titleText":"US Wildfire Activity","scaleBarOptions":{},"legendOptions":{"operationalLayers":[]}}}
- « Previous
-
- 1
- 2
- Next »
- « Previous
-
- 1
- 2
- Next »