- Home
- :
- All Communities
- :
- Products
- :
- ArcGIS Network Analyst
- :
- ArcGIS Network Analyst Questions
- :
- Re: service area
- Subscribe to RSS Feed
- Mark Topic as New
- Mark Topic as Read
- Float this Topic for Current User
- Bookmark
- Subscribe
- Mute
- Printer Friendly Page
- Mark as New
- Bookmark
- Subscribe
- Mute
- Subscribe to RSS Feed
- Permalink
Buongiorno
I am trying to use network analysis - service area - to create a polygon based on distance, for example 1000 meters.
In my case, dot = schools. So I want to see an area covered by 1000 meters.
There's one thing I can't understand... Why does it generate some weird clippings? as in the photo
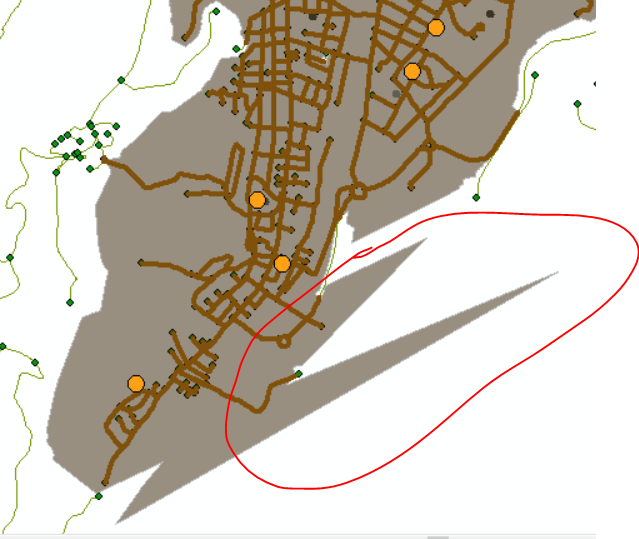
Thank you so much!
Thai
serviceareapolygonsnetworkanalysis footprint polygon nearest distance
Solved! Go to Solution.
Accepted Solutions
- Mark as New
- Bookmark
- Subscribe
- Mute
- Subscribe to RSS Feed
- Permalink
From this video, I see that your network dataset has an unknown spatial reference. This could also be part of the problem. You should always give your data a spatial reference.
- Mark as New
- Bookmark
- Subscribe
- Mute
- Subscribe to RSS Feed
- Permalink
Make Service Area Analysis Layer (Network Analyst)—ArcGIS Pro | Documentation
did you specify a polygon_trim_distance?
are there roads and other locations outside your image? or have you clipped this image?
... sort of retired...
- Mark as New
- Bookmark
- Subscribe
- Mute
- Subscribe to RSS Feed
- Permalink
Hi Dan,
thanks to your answer!
no, I didn't use trim.
To create a network I used arcstra which are the roads.
There are no roads or places outside
In the video I show what I used as parameter...many things remain by default.
thanks a lot!
- Mark as New
- Bookmark
- Subscribe
- Mute
- Subscribe to RSS Feed
- Permalink
Spikes like that are a common artifact of the polygon generation algorithm in ArcMap. We have implemented a new and improved polygon generation algorithm that makes the Service Area polygons look more bubbly or cloudy and less spikey. You can access the new algorithm in one of two ways:
1) In ArcMap, open the properties of your network dataset. On the Optimizations tab, turn on the box for the Service Area Index. You might need to re-build your network dataset after this, but I can't remember. Future Service Areas using this network should use the newer algorithm.
2) Use ArcGIS Pro instead of ArcMap. ArcGIS Pro Service Areas always use the new algorithm.
- Mark as New
- Bookmark
- Subscribe
- Mute
- Subscribe to RSS Feed
- Permalink
Melinda many thanks for your reply!
I used the algorithm but nothing happened...maybe the algorithm has difficulty or is not adapted to arcmap 10.5.
I noted that if I used 'not overlapping' instead of 'merge by break value' genereted less spikes.
- Mark as New
- Bookmark
- Subscribe
- Mute
- Subscribe to RSS Feed
- Permalink
Hmm, that still does not look like polygons produced by the newer algorithm. Is your polygon detail level is set to Detailed? Or do you have hierarchy turned on? Either of those things will prevent the use of the newer algorithm in ArcMap.
Do you have a polygon trim distance set? If not, you should set one, and that may help reduce spikes.
- Mark as New
- Bookmark
- Subscribe
- Mute
- Subscribe to RSS Feed
- Permalink
I tryied as you say...its the same!
I noted that when I flag 'Service Area Index' as you indicate, after some seconds is not select anymore...its seems that don't remain selected
- Mark as New
- Bookmark
- Subscribe
- Mute
- Subscribe to RSS Feed
- Permalink
I can see in the video above that you are not using trim and that you have selected Detailed polygons. The Detailed polygons in ArcMap will never use the new Service Area algorithm. If you want to use detailed polygons and see the nice new polygons, you need to use ArcGIS Pro.
If you want to get rid of spikes using your existing Service Area layer in ArcMap, I suggest you set a polygon trim of something like 50-100 meters.
- Mark as New
- Bookmark
- Subscribe
- Mute
- Subscribe to RSS Feed
- Permalink
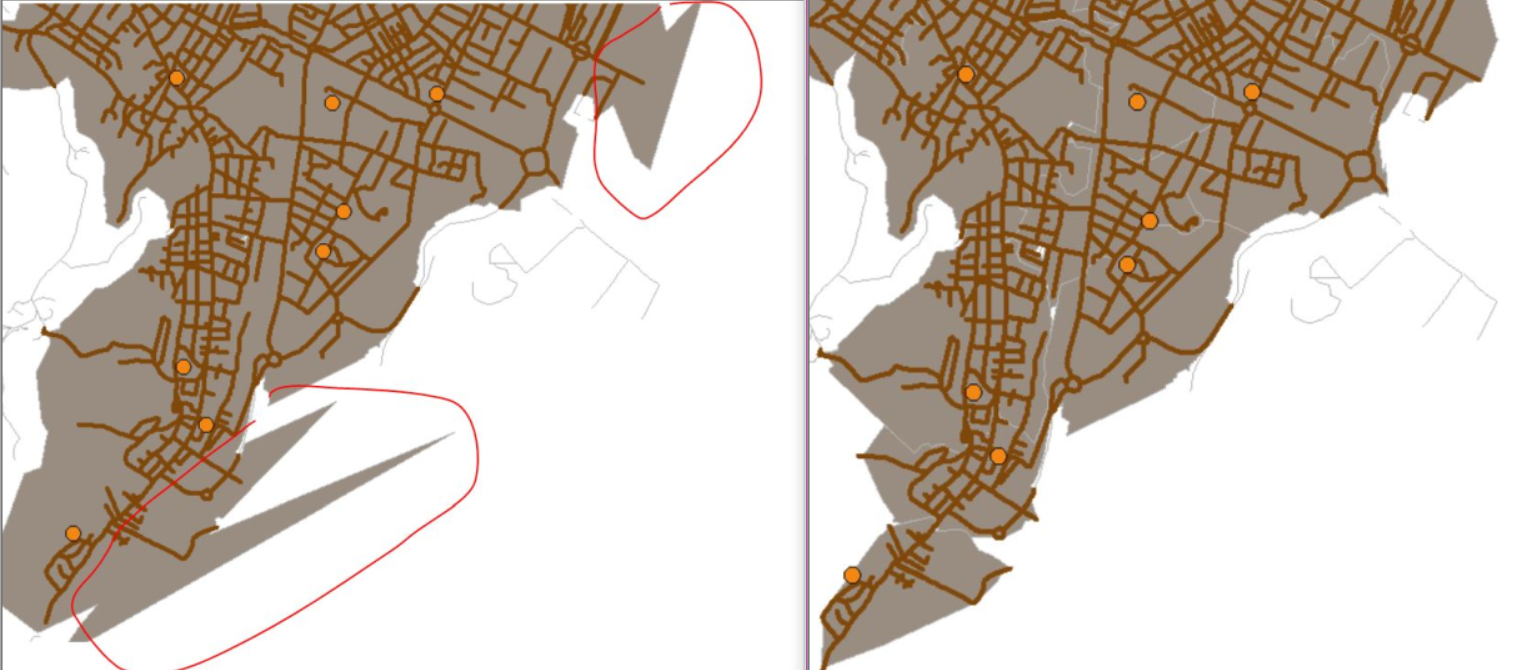
Hi Melinda, I followed all your instructions (as I show in this new video) The result generated a unique polygon when I used trim + merge polygon, without stranges spikes. I also used trim+no merge, which generated some internal clippings.
In neither of them the result is great but I understood the differences!
thanks so much!