Turn on suggestions
Auto-suggest helps you quickly narrow down your search results by suggesting possible matches as you type.
Cancel
- Home
- :
- All Communities
- :
- Products
- :
- ArcGIS Network Analyst
- :
- ArcGIS Network Analyst Questions
- :
- Re: Service Area Covering Polygone Problem
Options
- Subscribe to RSS Feed
- Mark Topic as New
- Mark Topic as Read
- Float this Topic for Current User
- Bookmark
- Subscribe
- Mute
- Printer Friendly Page
Service Area Covering Polygone Problem
Subscribe
4615
6
04-01-2012 02:28 AM
04-01-2012
02:28 AM
- Mark as New
- Bookmark
- Subscribe
- Mute
- Subscribe to RSS Feed
- Permalink
Hello,
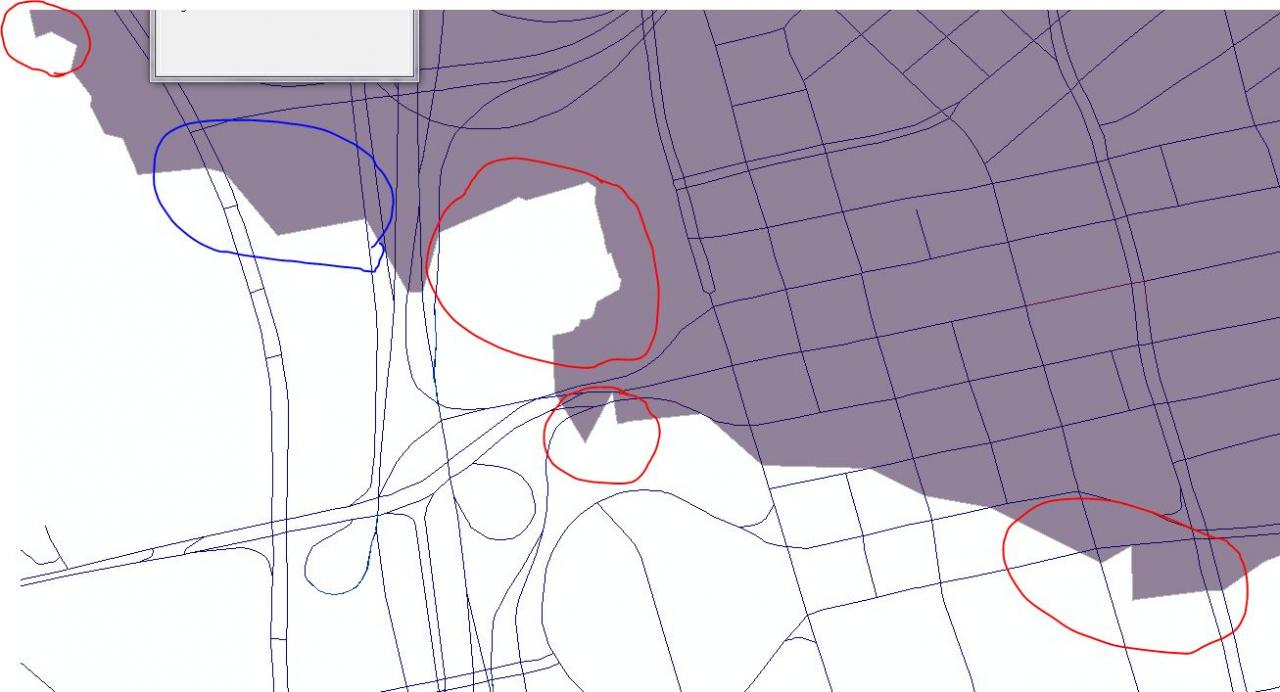
I try to build a Service Area Polygone based on a street Dataset und special Facilities. There is no Problem with those in my opinion. But the way the Polygons Area build are not logic. The Picture below shows that Problem. The Area wich is enclosed by the road is a Mountain without Roads. So why is that part includes bei the Polygon?
There are a lot of Areas with that kind of Problem. Every time a Area is surrounded by one or more Roads it is completly covered by the polygon. And it should just use the Parts next to the Roads.
Can somebody tell me, which option I have to change? I already tried every typ of polygon Generartion, included the "Trim Polygon" Feature with less than 10 Meters, but nothing happend. (The Image options are: Merge by break value, Deatiled, and Trim on 250 Meter, Ring)
I use the 9.2 Version.
I hope the problem is clear.
Thanks,
Sebastian
6 Replies
04-01-2012
07:48 PM
- Mark as New
- Bookmark
- Subscribe
- Mute
- Subscribe to RSS Feed
- Permalink
Sorry, forgot to tell: I use the 9.2 Version.
05-31-2012
11:32 AM
- Mark as New
- Bookmark
- Subscribe
- Mute
- Subscribe to RSS Feed
- Permalink
Hi Alan,
I am trying to understand in more detail how service area polygon geometry is generated.
The enclosed an image with few spikes highlighted. How or why are these generated?
I see the same results with a more detailed network i.e. Esri streetmap data.
Let me know if you need more information.
Thanks,
Jhansi
Hi Sebastian,
The behavior you observe is as designed. Whenever all the roads completely surrounding a region are included within the Service Area result, that entire region is included in the Service Area Polygon. This is so that the polygon isn't generated with an excessive number of "holes". For example, for a Service Area analysis in a standard city grid, you would expect your polygon to come back solid, as opposed to looking like a fish net.
To achieve what you are seeking, perform the Service Area analysis to generate Lines as output, and then run the Buffer tool on the resulting lines to generate polygons that only cover the areas that are within the specified buffer distance (say, 250 meters) from the road.
Alan
06-05-2012
06:47 AM
- Mark as New
- Bookmark
- Subscribe
- Mute
- Subscribe to RSS Feed
- Permalink
Thanks Alan!
06-14-2012
10:50 AM
- Mark as New
- Bookmark
- Subscribe
- Mute
- Subscribe to RSS Feed
- Permalink
Hi Alan,
I understood the spikes part of the polygons. However, I was playing around with other analysis layer settings and created a service area layer with lines and polygons.
Attached is an image file showing 50, 100 miles polygons. Although, the 100 miles polygon is overlapped by the lines layer, along the road unlike the 50 mile polygon.
Just trying to interpret the results.
Thanks,
Jhansi
12-03-2012
07:07 AM
- Mark as New
- Bookmark
- Subscribe
- Mute
- Subscribe to RSS Feed
- Permalink
Hi Alan (and others that could help with this question),
I have the same question as Jhansi with respect to trying to understand how the detailed polygon geometry is generated. It's not clear to me how exactly the boundaries are generated and I haven't had much luck with finding details. This is information is needed for a publication.
Any help would be greatly appreciated!
Kate
Hi Alan,
I am trying to understand in more detail how service area polygon geometry is generated.
The enclosed an image with few spikes highlighted. How or why are these generated?
I see the same results with a more detailed network i.e. Esri streetmap data.
Let me know if you need more information.
Thanks,
Jhansi
Hi Jhansi,
Recall that service area polygons are only meant to be accurate at the points where its boundary crosses the roads; what the boundary does in the space away from the roads is not formally defined and is mostly an "art", if you will. What Network Analyst tries to do to define the boundary in the open space is to take into account the impedance level (the travel time/distance away from the facility) of all the roads that surround the open spaces -- roads both inside and outside of the polygon are considered.
What makes things even more obscure is that polygons are meant to be a smooth and continuous two-dimensional surface. Unfortuantely the road network is often three-dimensional (with overpasses and underpasses) and directional (the two parallel one-way sleeves of a divided highway are separated by a very narrow median of space, and one-way streets that can only be accessed by "going around" from the other side), which means that the impedance level for a road (i.e., the travel time/distance that road is from the facility) can be drastically different for two roads that are in such close XY proximity. These usually are the culprit of most of the sharper spikes you see in the resulting polygon, as the polygon generator does its best to try to account for such drastically differing values in such a small space.
Hopefully this somewhat explains why the polygons are generated the way they are. Keep in mind that you can always export the polygon result to a feature class and smooth it out yourself to the desired visual appeal to effectively communicate the area that is "covered" by the facility in the particular scenario you're presenting.
Alan
12-04-2012
01:23 PM
- Mark as New
- Bookmark
- Subscribe
- Mute
- Subscribe to RSS Feed
- Permalink
Kate,
The basic algorithm is documented online, see the service area section here:
http://resources.arcgis.com/en/help/main/10.1/#/Algorithms_used_by_the_ArcGIS_Network_Analyst_extens...
Jay Sandhu
The basic algorithm is documented online, see the service area section here:
http://resources.arcgis.com/en/help/main/10.1/#/Algorithms_used_by_the_ArcGIS_Network_Analyst_extens...
Jay Sandhu