- Home
- :
- All Communities
- :
- Products
- :
- ArcGIS Monitor
- :
- ArcGIS Monitor Questions
- :
- Instance Saturation Percent Metrics doesn't repres...
- Subscribe to RSS Feed
- Mark Topic as New
- Mark Topic as Read
- Float this Topic for Current User
- Bookmark
- Subscribe
- Mute
- Printer Friendly Page
Instance Saturation Percent Metrics doesn't represent the correct value
- Mark as New
- Bookmark
- Subscribe
- Mute
- Subscribe to RSS Feed
- Permalink
I'm using arcGIS Monitor 2023.1 .
I have a service with min 11 max 15 Instances, when analyzing it I've notice some metrics that doesn't adds up:
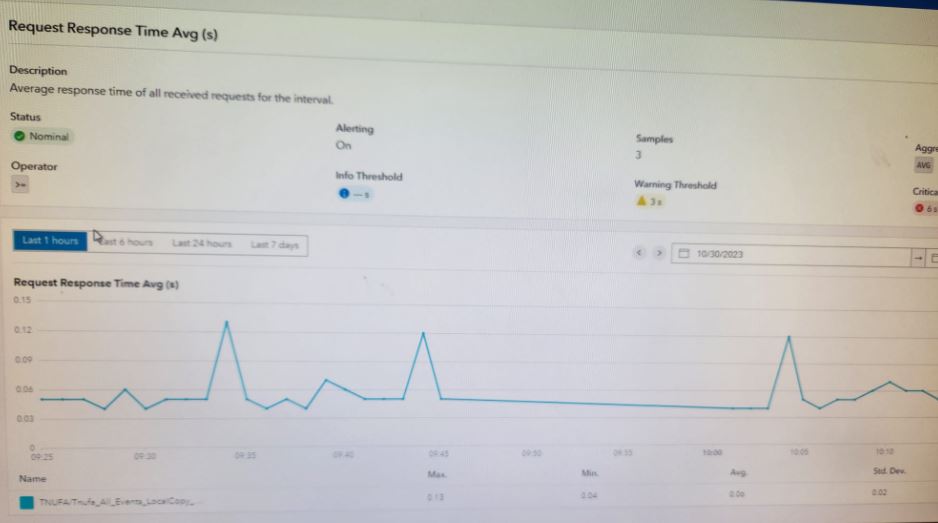
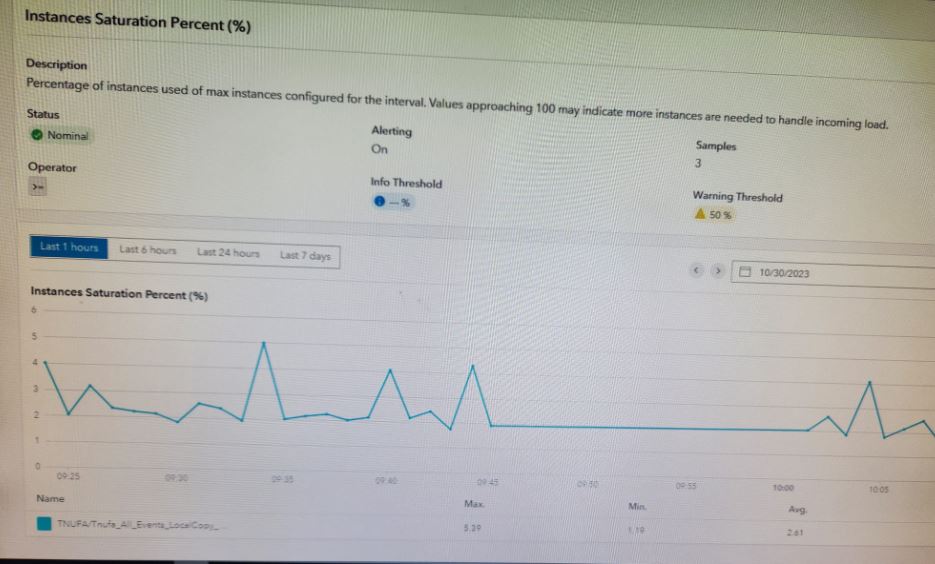
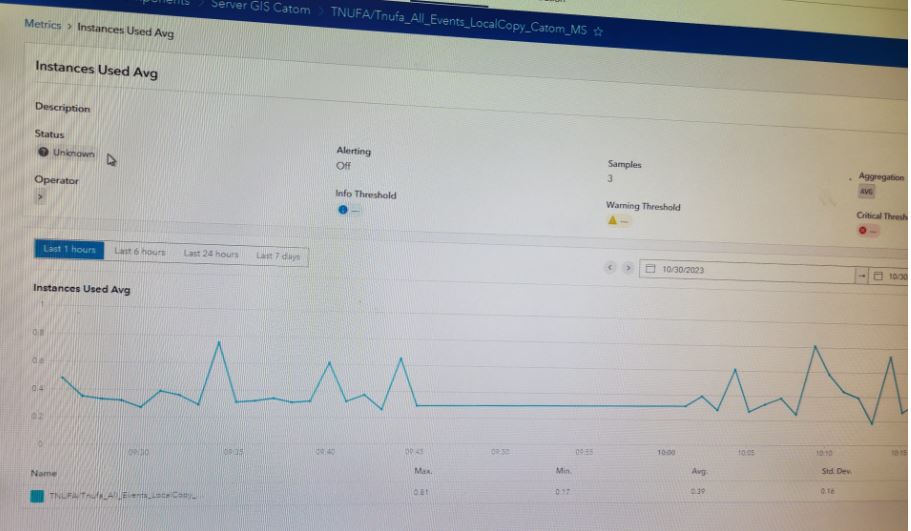
1."Request Response Time Avg" and "Request Response Time Max" went up where as the "Instance Saturation Percent" and "Instances Used Avg" are very low (the Saturation points to 5% and the Avg Used points to 0.15)
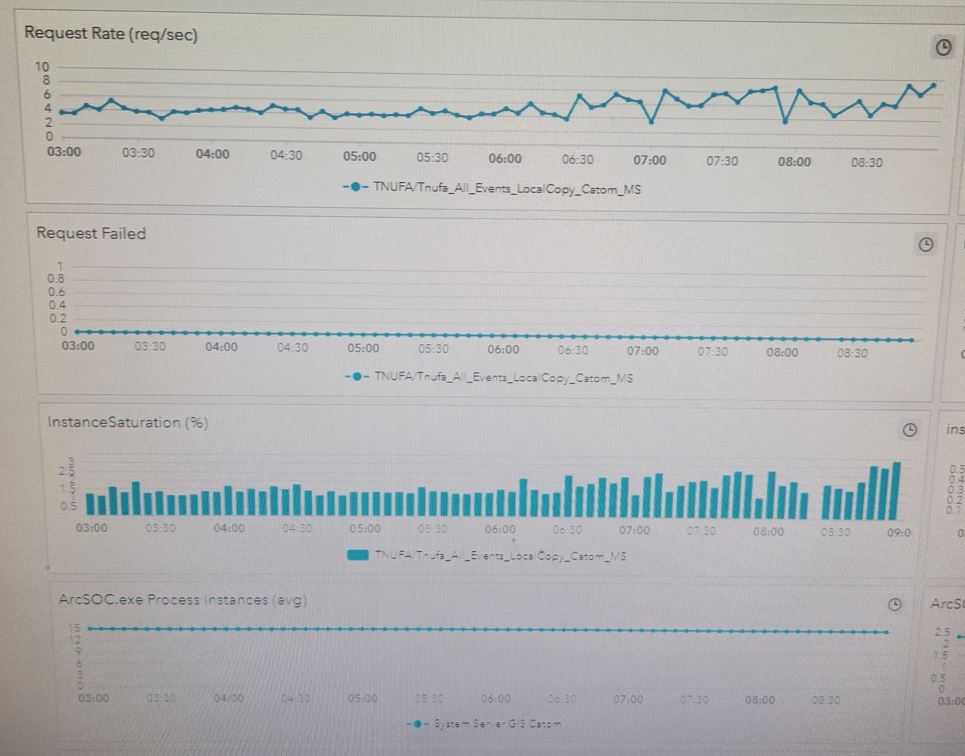
2. when checking the "Process Instances - arcsoc.exe" metrics on the host I found that it is using almost all the 15 instances and probably that is why the Response time went up.
I have attached screenshots of these metrics.
I guess my question is , and this is known issue? or I misanalyse/misunderstood the metrics data?
Solved! Go to Solution.
Accepted Solutions
- Mark as New
- Bookmark
- Subscribe
- Mute
- Subscribe to RSS Feed
- Permalink
- Instance Saturation Percent and Instances Used Avg are tightly related and reflect in use instances:
Instance Saturation Percent=Instances Used Avg/Instance Max*100
Arcsoc.exe CPU (but not count) reflects instances in use, and therefore should correlate with the Instance Saturation Percent and Instances Used Avg
- arcsoc.exe process count reflects instances running. Note, you can technically have all instances running idle, in your case 15, with 0 load, see my explanation above.
- Let's analyze the last reading in your screenshot
Instance Saturation Percent=0.45/15*100=3.3%
- Mark as New
- Bookmark
- Subscribe
- Mute
- Subscribe to RSS Feed
- Permalink
Note, the instances used and saturation reported by ArcGIS Monitor are approximation of Instances in Use, not Instances Running (which is measured by arcsoc.exe process), see below:

Also, the response time degradation you showed is present during time where there are 11 instances (the right side of the chart, after 10). So this degradation does not correlate well with the arcsoc.exe process.
This performance fluctuation could be due to different request/response, e.g. different size of the features fetched and not instance saturation. To verify it, you'd need to set logs temporarily to verbose and verify elapsed time and features returned.
One potential explanation of your case of higher instances running during this time and low instances in use might be the result of the previous spike (e.g. 8:00) and these idle instances are waiting to be recycled down. This is controlled by The maximum time an idle instance can be kept running (default 1800 sec), see https://enterprise.arcgis.com/en/server/latest/publish-services/windows/tuning-and-configuring-servi...
To diagnose it, please provide request rate, request received and request failed for this time and 1 hour before. Also, any chance min max setting where changed around that time? Finally, please take a clear screenshot (the images you shared difficult to read) or if easier, please email Excel Report to me?
- Mark as New
- Bookmark
- Subscribe
- Mute
- Subscribe to RSS Feed
- Permalink
Thank you for the detailed answer , I still have question though,
Is there a correlation between "Instance Saturation Percent", "Instances Used Avg", and "Process CPU Utilized for arcsoc.exe" service?
For instance, if a service has values of min 14 - max 17 instances with a consistent usage of 15(running instances), as observed in Process CPU Utilized for arcsoc.exe, should the "Instance Saturation Percent" display 80%? Or does it solely reflect 'IN USE' rather than 'RUNNING'?
I'm attaching two screenshot displaying the metrics of the service .
- Mark as New
- Bookmark
- Subscribe
- Mute
- Subscribe to RSS Feed
- Permalink
- Instance Saturation Percent and Instances Used Avg are tightly related and reflect in use instances:
Instance Saturation Percent=Instances Used Avg/Instance Max*100
Arcsoc.exe CPU (but not count) reflects instances in use, and therefore should correlate with the Instance Saturation Percent and Instances Used Avg
- arcsoc.exe process count reflects instances running. Note, you can technically have all instances running idle, in your case 15, with 0 load, see my explanation above.
- Let's analyze the last reading in your screenshot
Instance Saturation Percent=0.45/15*100=3.3%
- Mark as New
- Bookmark
- Subscribe
- Mute
- Subscribe to RSS Feed
- Permalink
Thank you so much for the clarification now it all make sense.
looking forward for the 2023.3 versions.
Regards,
iris