- Home
- :
- All Communities
- :
- Products
- :
- ArcGIS Maps for Adobe CC
- :
- ArcGIS Maps for Adobe CC Blog
- :
- Map Updates and Other Design-Worthy Datasets ........
Map Updates and Other Design-Worthy Datasets .....you might not have known we have
- Subscribe to RSS Feed
- Mark as New
- Mark as Read
- Bookmark
- Subscribe
- Printer Friendly Page
The map data hosted in Esri’s geospatial cloud is one of the most valuable parts of the ArcGIS Maps for Adobe Creative Cloud extension. It is the data that fuels your designs. In this blog we’ll highlight a number of unique maps and layers that have been configured specifically for use within Adobe. We’ll also mention other generic datasets you might find useful for your mapping projects.
Maps for Adobe has two unique vector basemaps; Vector Street Map and Natural Earth. Both have been designed and configured specifically for use within the extension.
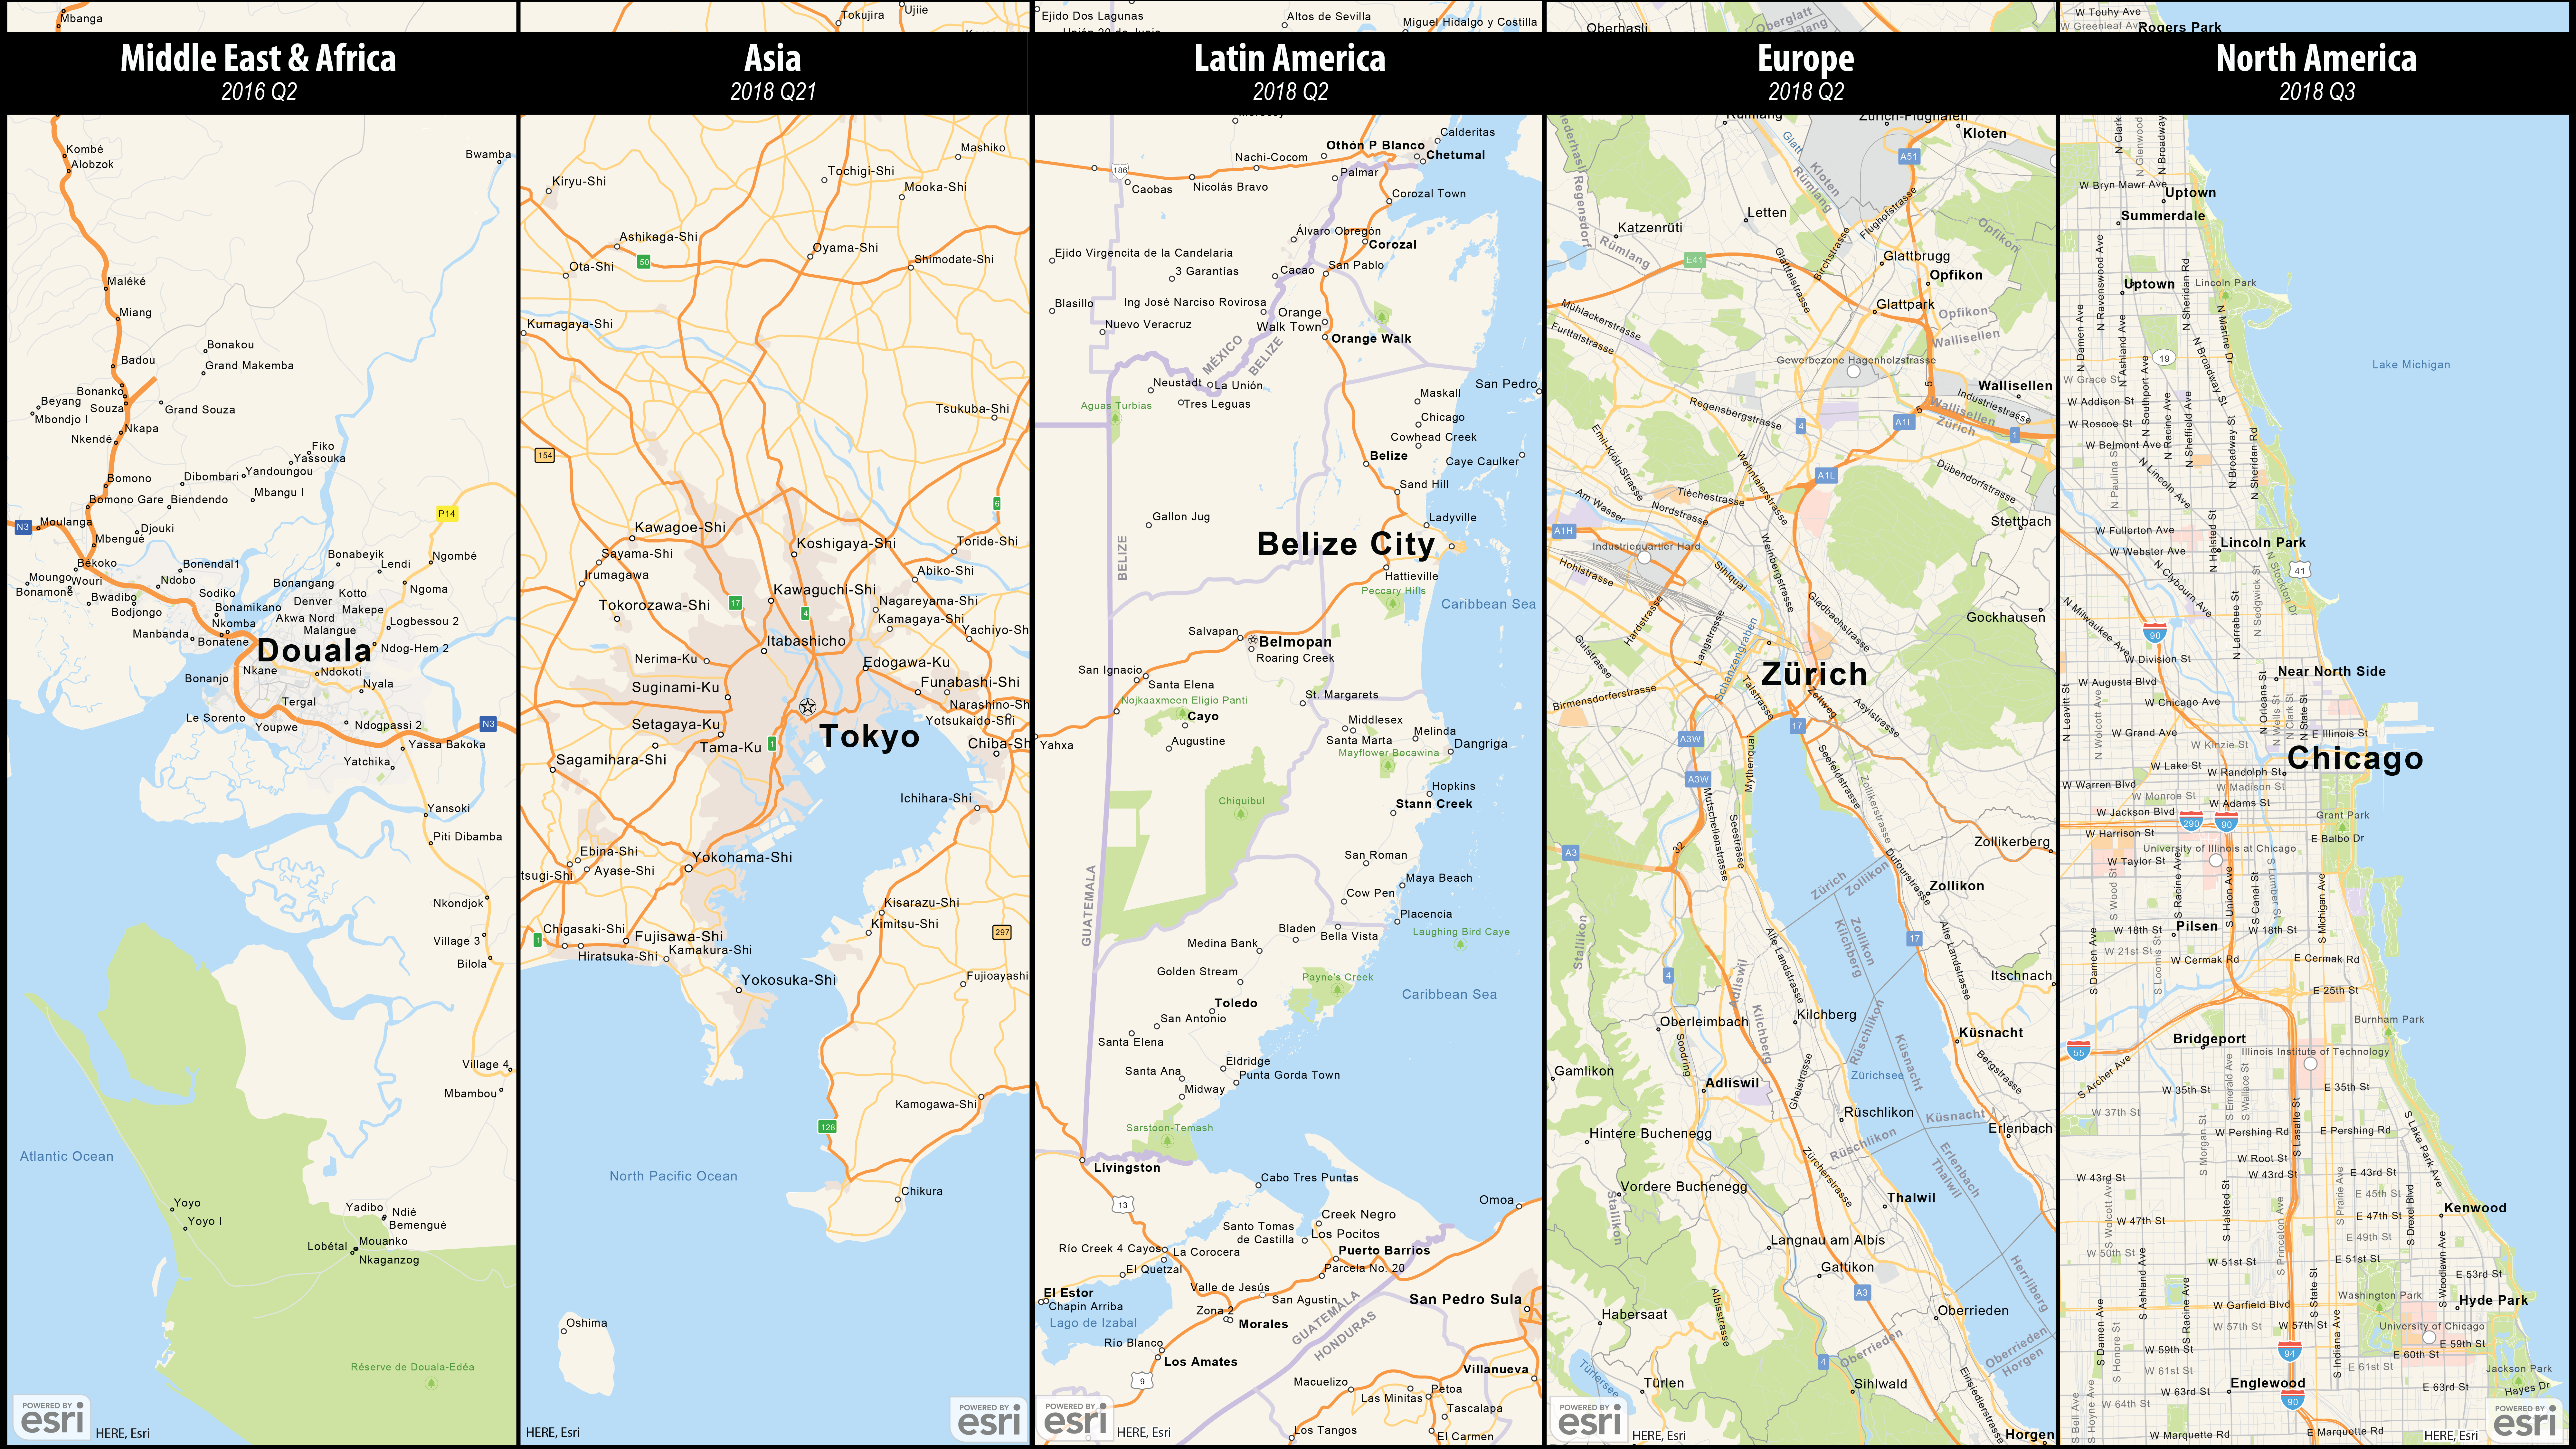
Vector Street Map – This is the most popular map used within the extension. It is great to use if you want editable vector artwork in Illustrator over any part of the world! There is great detail all the way down to the city block level, and even higher levels of detail in most large urban centers around the world. While the focus of this map is on urban locations and features (eg. POIs and roads), it can also be used as a great reference map at smaller scales when you need a map of states, provinces, countries or even the globe. The data used in this map has also been recently updated to the most current versions available:

Natural Earth – This is the 2nd most popular map used in the extension, and is another map specifically designed for use within Maps for Adobe. It is based on the free public domain Natural Earth data built through a collaboration of volunteers and supported by the North American Cartographic Information Society (NACIS). It is a great general purpose vector map, but we’d suggest you use the Vector Street Map if you need city or street level detail. The data is best suited for larger county, regional, or ideally country level maps. Natural Earth has also been updated to the latest version, 4.0 which was released in 2017.
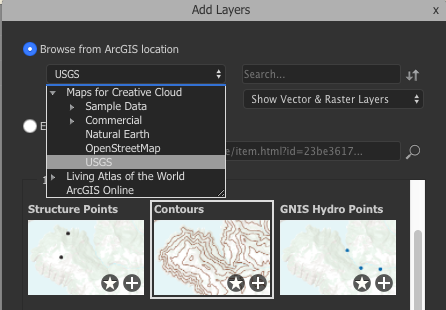
Sometimes having the whole basemap is too much. Adding too many layers to Illustrator can affect file size, performance and introduce unnecessary layer management overhead. To help, we’ve introduced a number of Natural Earth layers grouped by theme. These are Populated Places, Transportation, Boundaries, Hydrography, Bathymetry and Grids and Graticules. You can find these layers in the ‘Add Layers’ dialog under ‘Browse from ArcGIS Location > Maps for Creative Cloud > Natural Earth’.


USGS – We have added a number of valuable layers from The National Map (TNM) provided by the United States Geological Survey (USGS). The data is current up to 2016 at the national level, and includes such layers as trails, physical, structural and cultural points in addition to Federal and Native American lands, plus a woodland layer representing tree coverage for the country.
We have also made all the USGS contours (elevation lines) for the entire country available. Cartographers and designers alike love contours for the aesthetic they can bring to a map! The USGS uses digital methods and sources to construct this data, however much of the national coverage is derived from paper topographic maps that may be decades old. This is usually not an issue though, as contours typically do not change much over time. It is also important to note that the contour density and interval may change at historic map sheet extents. The contour layer is best used at larger scales (1:24,000 to 1:100,000, like the old paper topographic maps) as they can be pretty detailed. Due to the density of this data, larger maps with small scales can add thousands of lines to your map, possibly resulting in degraded performance when drawing and downloading. So remember, with great (data) power comes great (map) responsibility 

You can find the USGS layers in the ‘Add Layers’ dialog under ‘Browse from ArcGIS Location > Maps for Creative Cloud > USGS’.
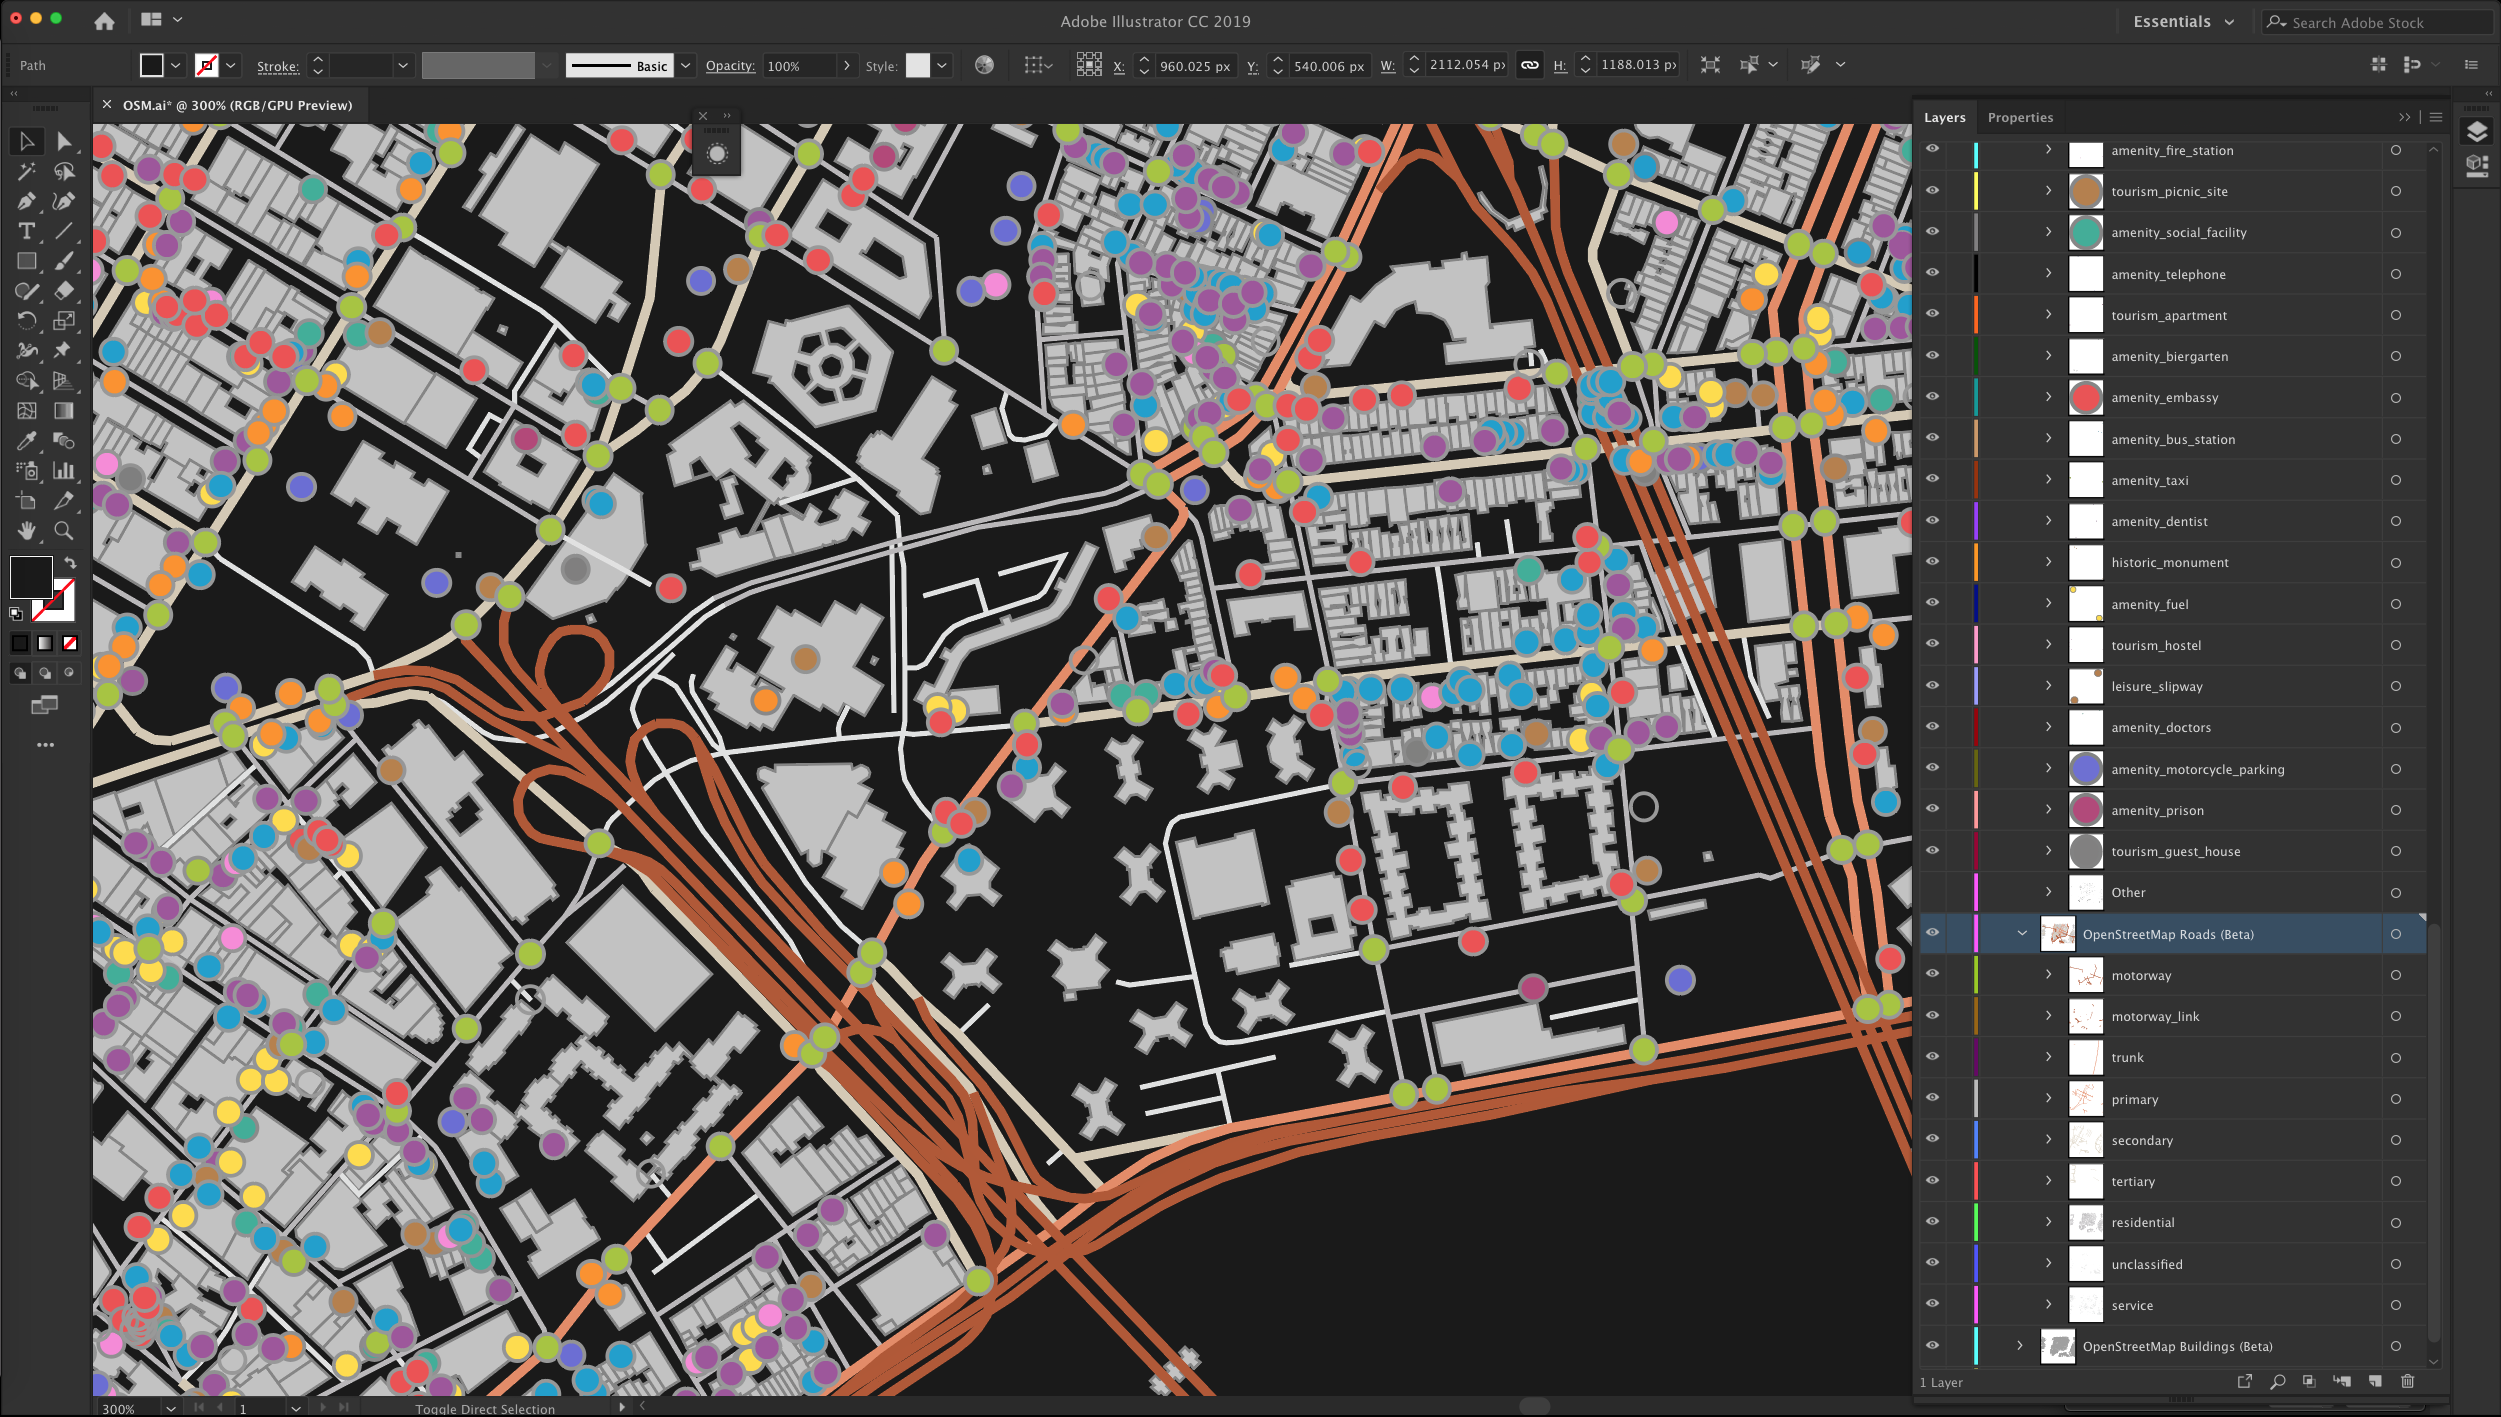
OSM – OpenStreetMap is a collaborative project intended to create a free editable map of the world. It is wildly popular because of its high level of detail, global coverage and the fact that it can be edited by anybody in near real time. Esri has released 3 of the most used OSM layers as dynamic vector layers into ArcGIS Online. You can find building footprints, roads and points of interest layers from the ‘Add Layers’ dialog under ‘Browse from ArcGIS Location > Maps for Creative Cloud > OpenStreetMap’.
These layers are highly detailed and best suited for larger scale maps, from city level down to individual buildings (approximately from 1:72,000 to 1:1,000). In many areas it is the most detailed urban data available, but since it is crowd-sourced content there are inconsistence in coverage and attributes. Despite this, OSM is typically the best source of data for many developing parts of the world. Due to the complexity of the OSM data, doing things like changing the layer style or setting up labels can take some time. You will also get cleaner, more accurate vectors in Illustrator if you increase the DPI above the 96 DPI default. This may result in longer sync times so you will need to have a little patience, but it will be well worth it. Expect to see more OSM layers and options coming in the future.

You can find the OSM layers in the ‘Add Layers’ dialog under ‘Browse from ArcGIS Location > Maps for Creative Cloud > OpenStreetMap’.

Business Locations – This layer of business locations is extracted from a comprehensive list of businesses licensed from InfoGroup. The layer contains data for more than 13 million U.S. businesses, and it can be styled based on business name (CONAME) or by North American Industry Classification (NAICS) code.

Tapestry – This is Esri's geodemographic market segmentation system which classifies U.S. neighborhoods into 67 segments based on their socioeconomic and demographic composition. For a broader view of markets, segments are grouped into 14 LifeMode Summary Groups that reflect lifestyles/life stages and 6 Urbanization Summary Groups that show levels of affluence and population density. The 2017 version of this layer was the 3rd most popular layer used in Maps for Adobe. There is a new layer out for 2018, and you can access it by entering it’s URL into the ‘Add Layers’ dialog:
https://www.arcgis.com/home/item.html?id=2de5ed56740947759e0f53d6330e0a84

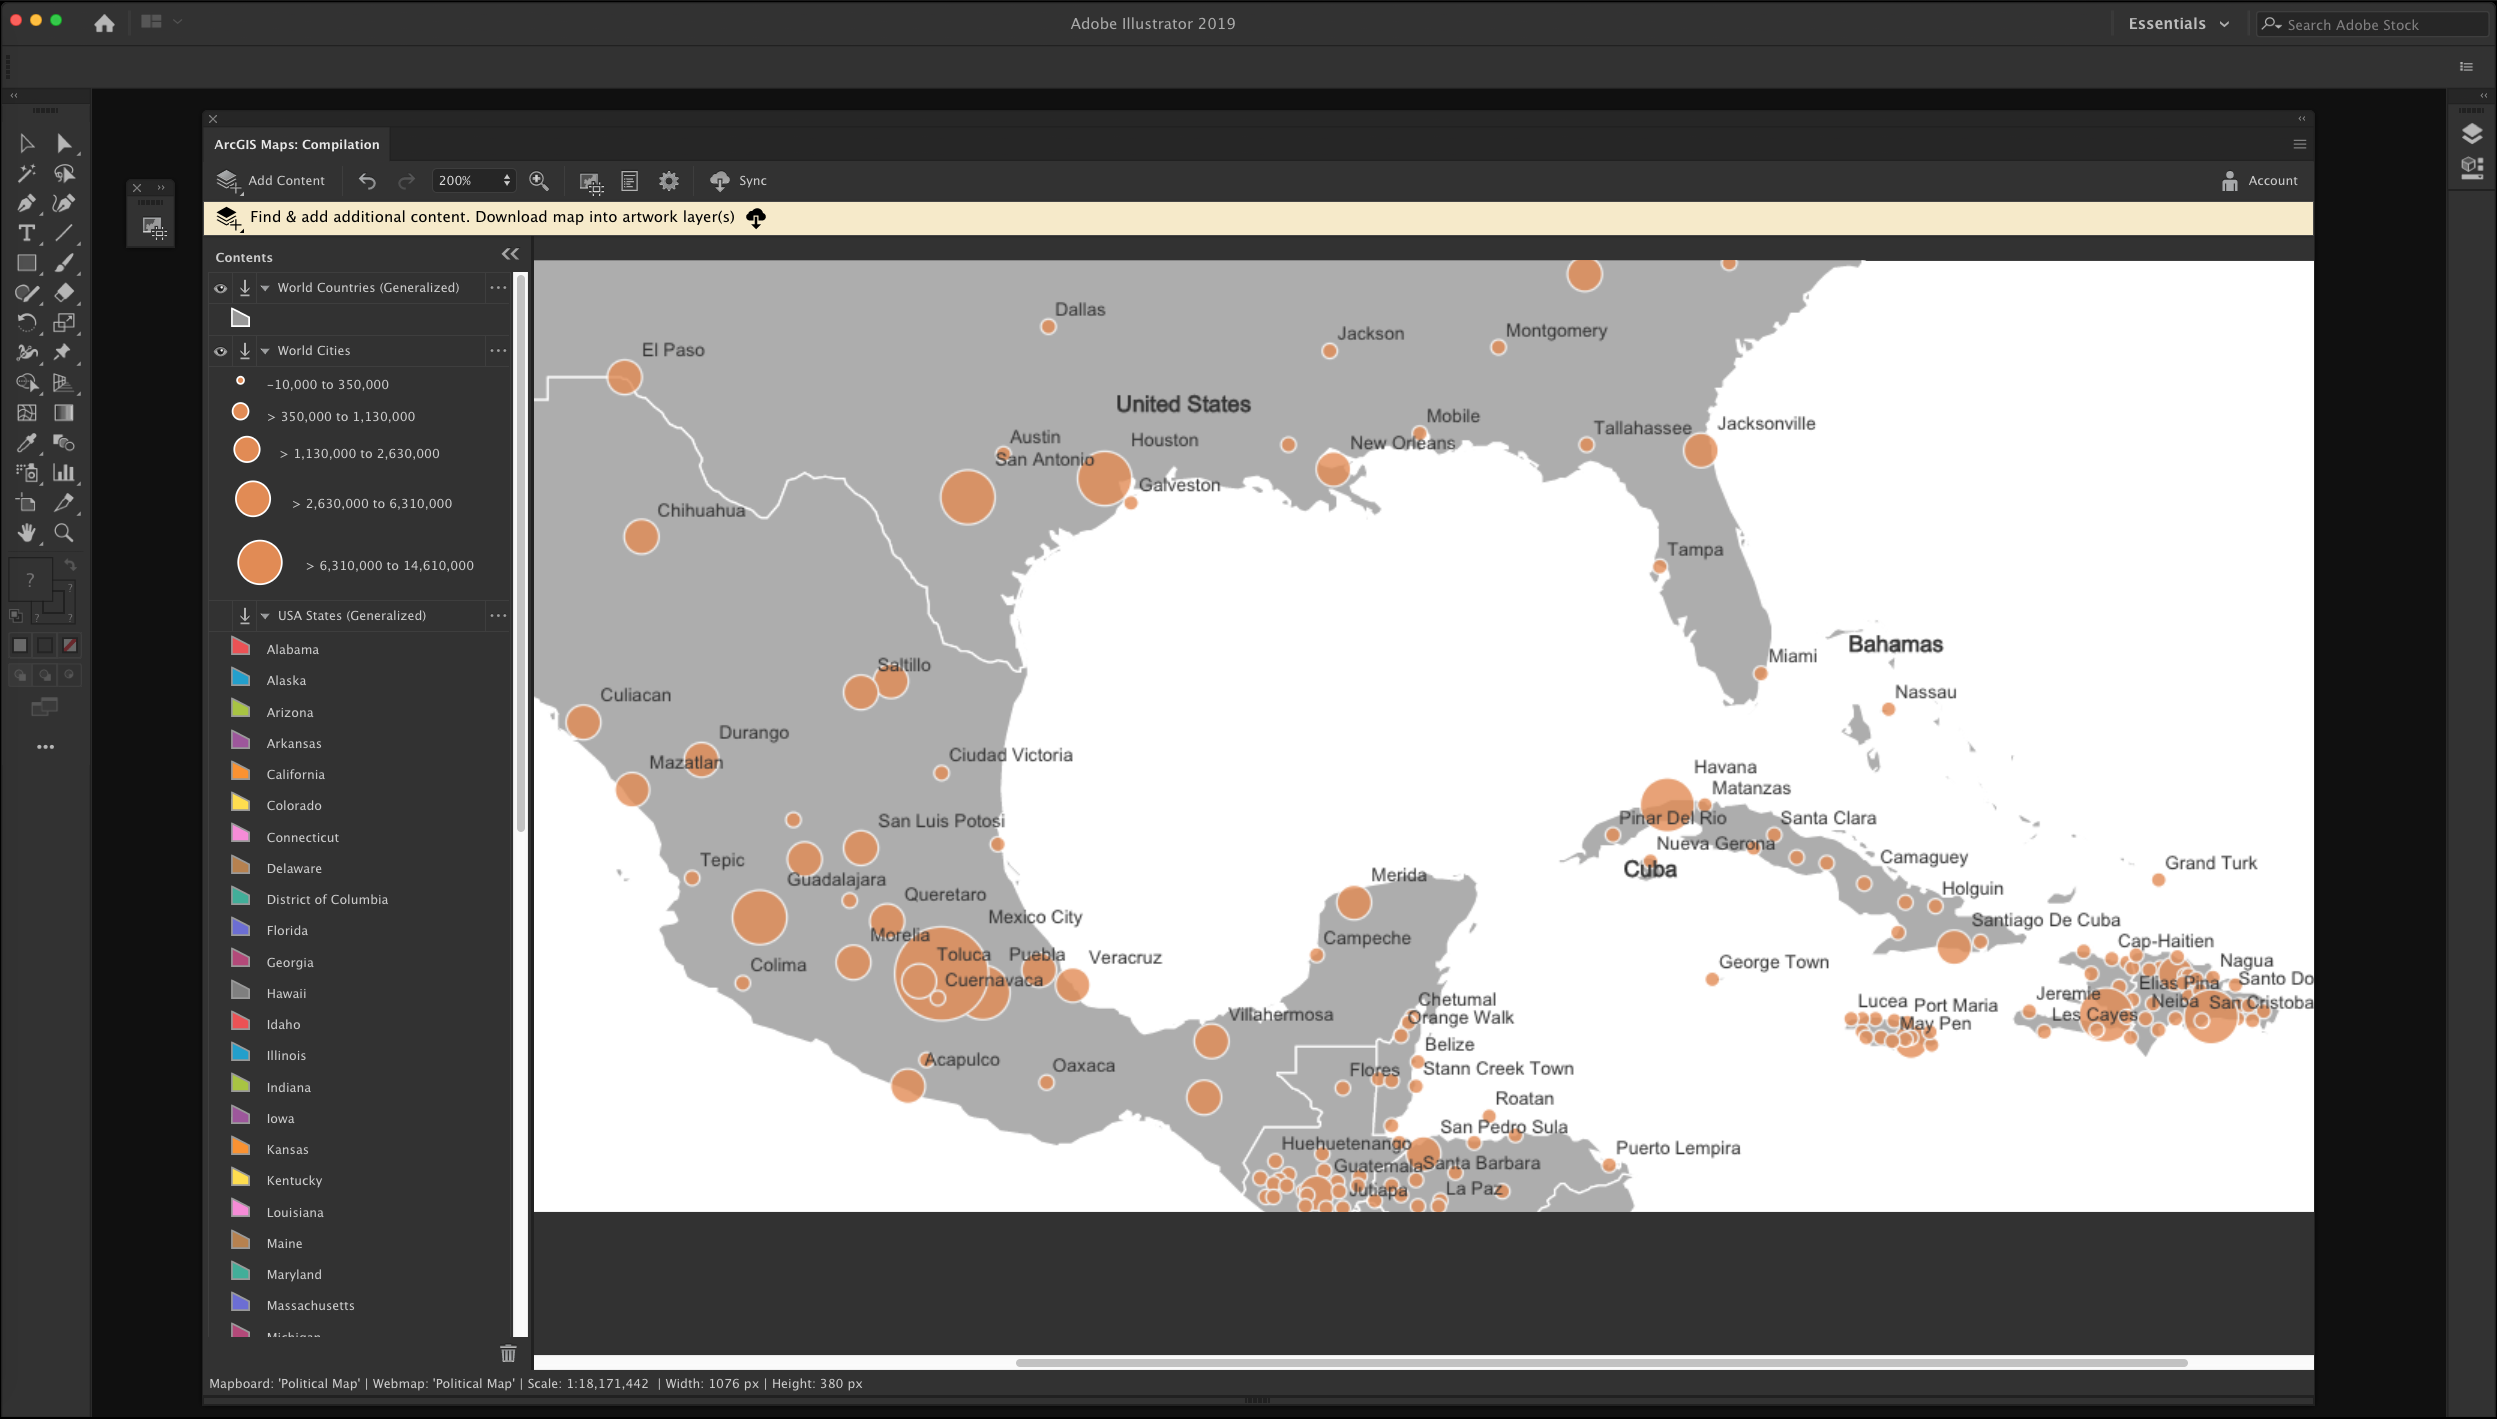
Political Map – This is a simple world political map showing global country and US state boundaries, and it is also one of the most popular maps used within the Maps for Adobe extension. Because the data is less detailed than other layers, it is great for making overview maps. The default style shows each country with a unique color, however that can be easily changed to a single symbol if you are looking for something a little more muted.
There is a great collection of content available within ArcGIS Online and it is constantly growing with contributions from Esri, our business partners, and our users. If you are looking for something but cannot find it, please let us know.
You must be a registered user to add a comment. If you've already registered, sign in. Otherwise, register and sign in.