Tune in from Tuesday through Thursday (Jan. 9th-11th) each day at 3 p.m PST to see Sarah Bell present ArcGIS Maps for Adobe Creative Cloud on AdobeLive!
AdobeLive Link:
https://www.behance.net/live
The 3 recordings will be posted by Adobe to their YouTube channel, the links to these plus the Q&A from the events can be found below.
Live Vector Art with Sarah Bell from Esri 1 of 3 - YouTube
Live Vector Art with Sarah Bell from Esri 2 of 3 - YouTube This one has a good overview of Maps for Adobe at the beginning
Live Vector Art with Sarah Bell from Esri 3 of 3 - YouTube
Questions and Answers:
What does Esri do?
Esri builds mapping and analytic software to answer location based questions (e.g. Site or store locations, managing utility (power, water) networks, land and resource management, and much more…) and communicates those answers visually through maps (static, web/interactive, 3D, etc.…).
More about Esri and what we do:https://www.esri.com/en-us/about/about-esrihttps://www.esri.com/en-us/about/about-esri
What is ArcGIS?
ArcGIS is Esri’s mapping and location analytics platform. ArcGIS is to Esri as Creative Cloud is to Adobe. It’s a collection of software and services.
Learn more: http://www.esri.com/arcgis/about-arcgishttp://www.esri.com/arcgis/about-arcgis
Check out the Maps We Love!
All of the Maps We Love are all built with Esri technology by our users and/or Esri staff. The site highlights how the maps were made (technology products and steps) and why they are good example of effective cartography.
Explore the collection: http://www.esri.com/products/maps-we-lovehttp://www.esri.com/products/maps-we-love
Where do I get ArcGIS Maps for Adobe Creative Cloud Extension?
Here are the steps:
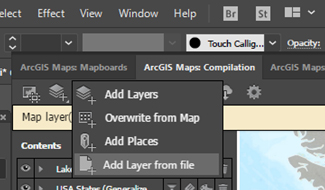
Install from Adobe Add-On/Exchange website
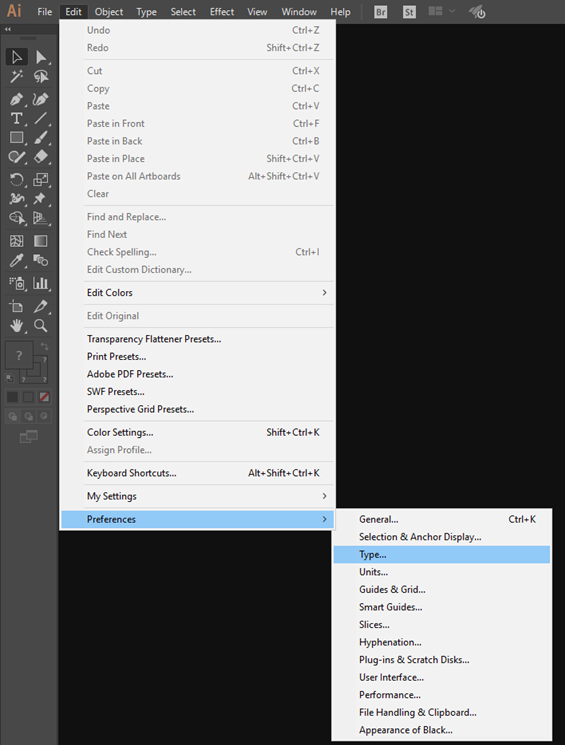
From the Ai or Ps menu, select Windows > Extensions > ArcGIS Maps for Adobe Creative Cloud.
Download now: https://exchange.adobe.com/addons/products/16913
I’m having issues installing can you help?
Sure! We have a great GeoNet community thread that outlines standard troubleshooting. If you’re still having issues, please feel free to post there and a member of the team ill be there to help.
YouTube: ArcGIS Maps for Adobe® Creative Cloud® - Install and Getting Started (Illustrator) - YouTube
Install Help: https://community.esri.com/thread/206428-trouble-installing-arcgis-adobe-cc-extension-after-cc-2018
Trouble installing ArcGIS Adobe CC extension after CC 2018
https://community.esri.com/thread/206812-installation-troubleshooting
How do I sign-in to the ArcGIS Maps for Adobe Extension?
You have two options for signing in:
- For free by providing your email address and Esri will send you an activation code which allows you to access public/free data/artwork hosted on Esri’s cloud (ArcGIS Online). This public data is provided by users, partners, and Esri; of course, you can use your own local data as well.
- Using an ArcGIS Online account (a for-fee Esri account similar to an Adobe Creative Cloud account) which gives you access to more advanced features in the extension with richer data/artwork.
Learn more about ArcGIS Online: http://www.esri.com/software/arcgis/arcgisonline
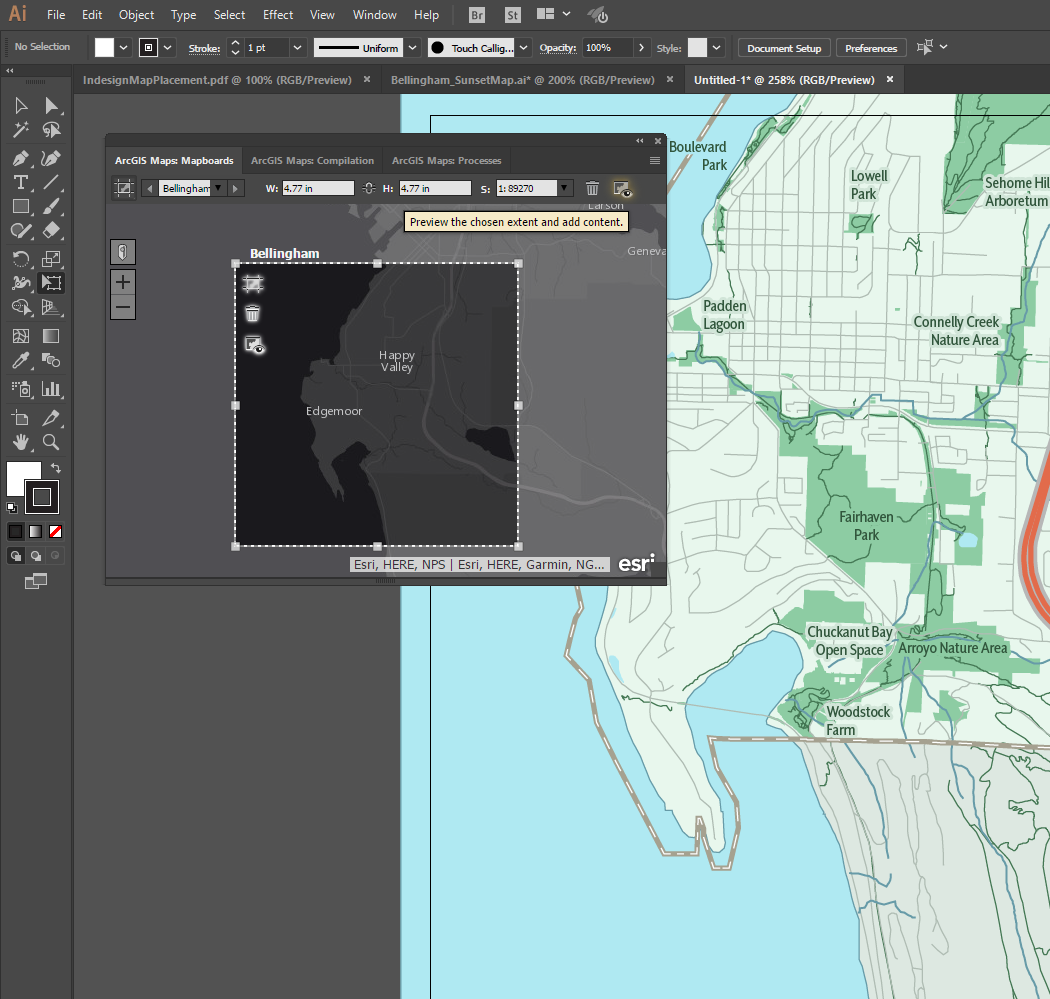
What is the typical (“simplest”) process to make a map?
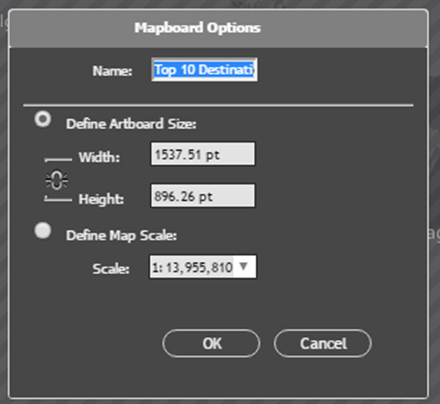
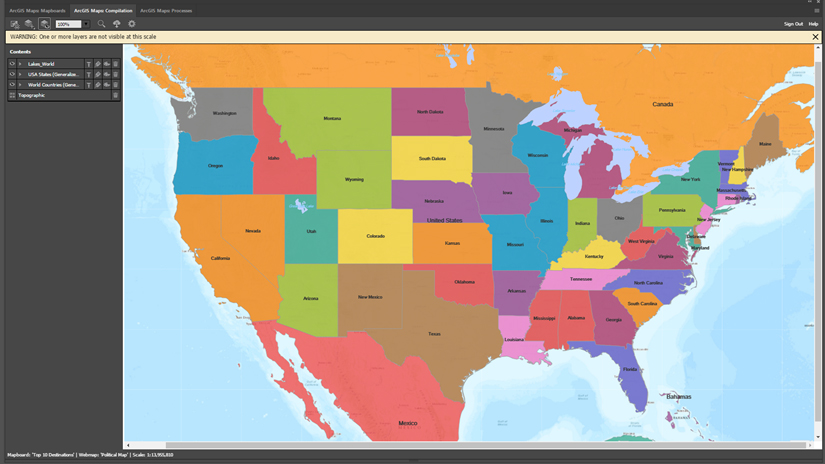
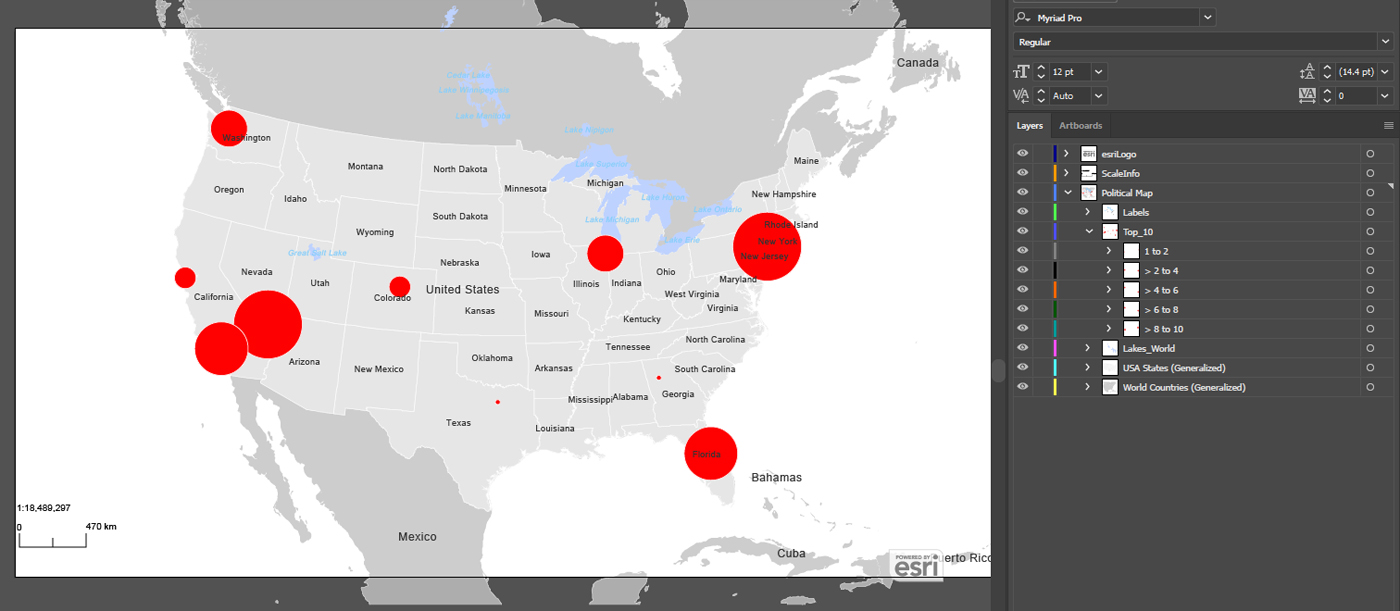
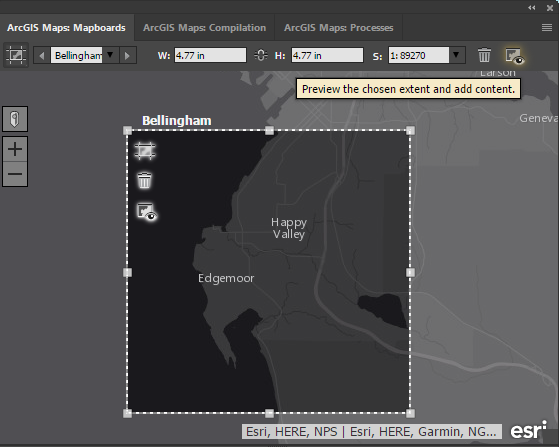
Navigate (pan and zoom) to the location you want to make a map of, in the mapboard tab/window. Or you can type in a place name or address and have the extension pan and zoom you there. Then draw a box (we call it a mapboard) that defines the size of the map. The geographic extent as well as the output artboard size you want in Ai or Ps.
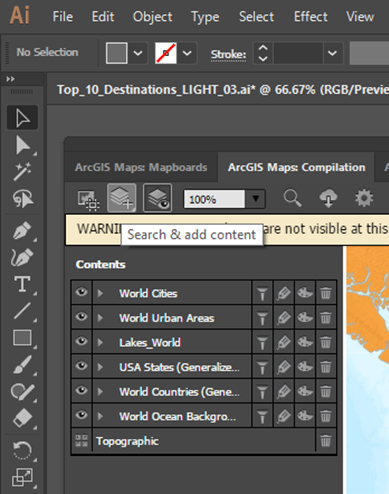
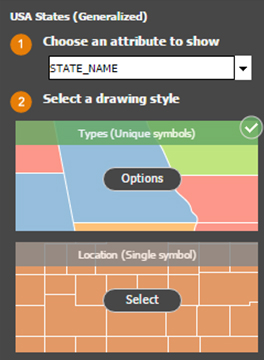
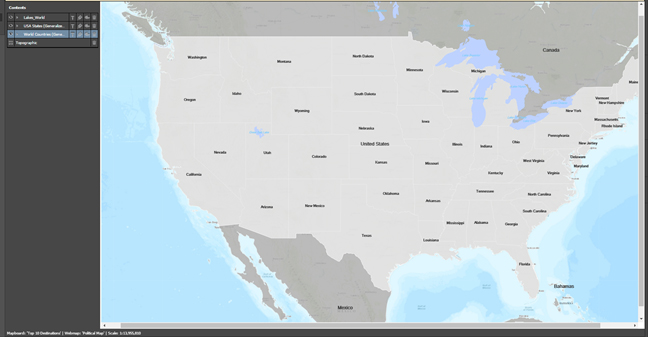
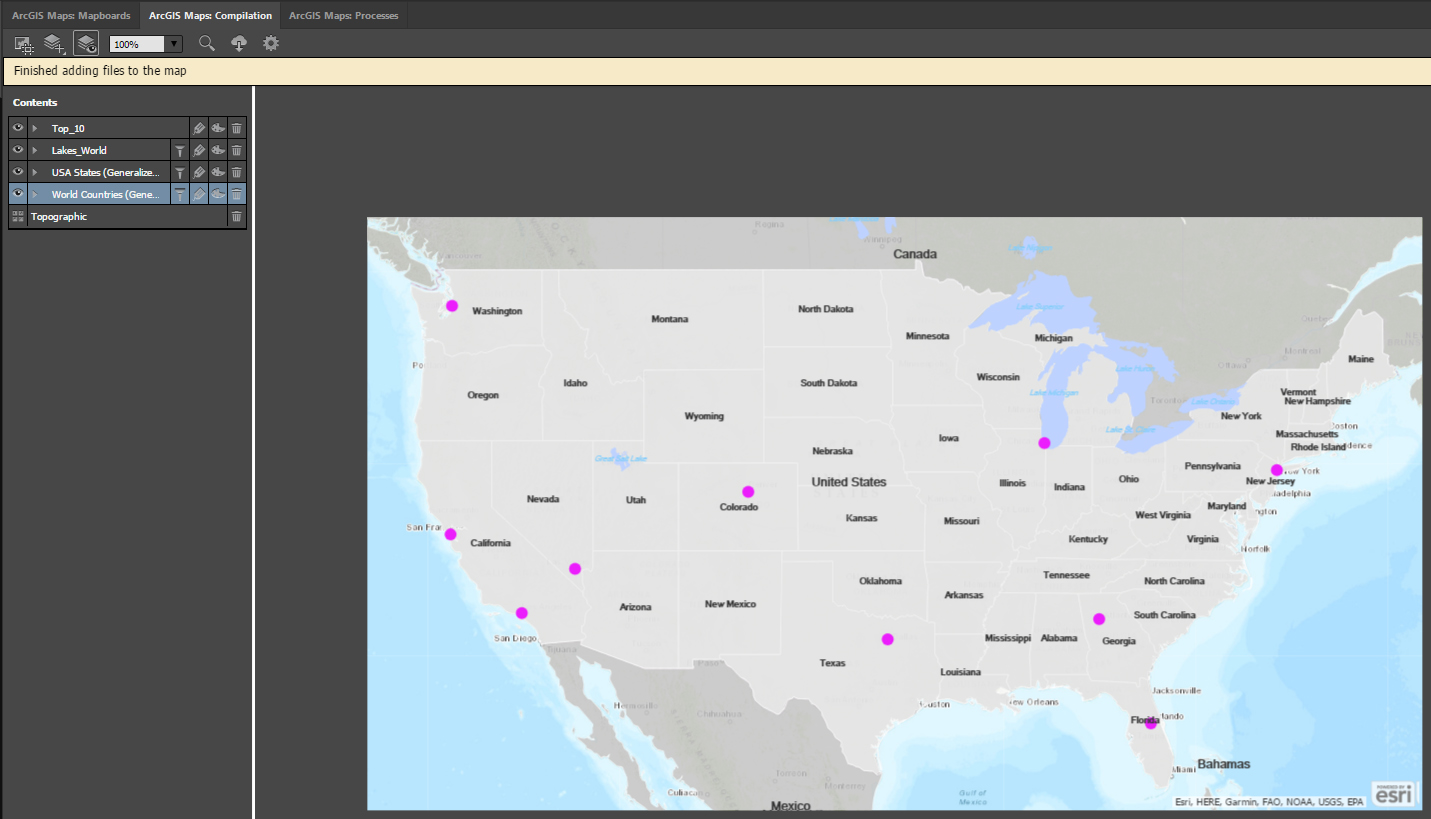
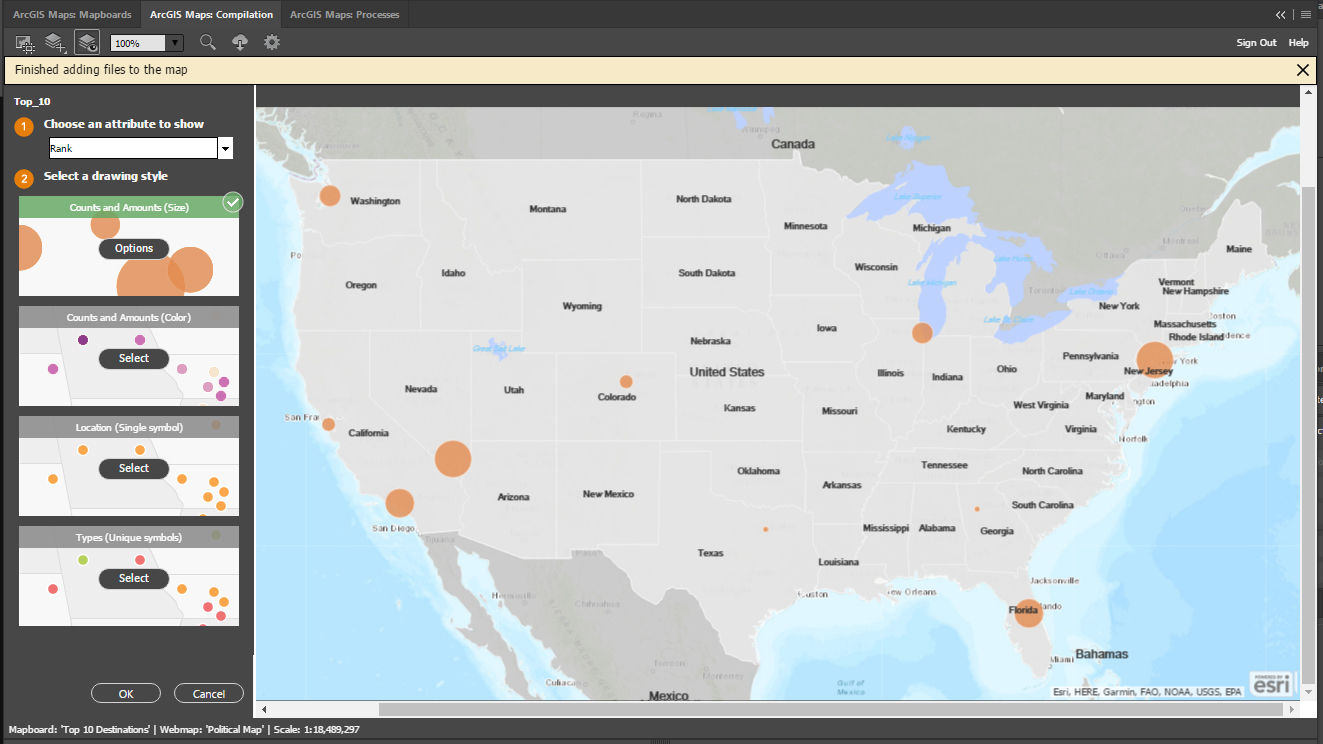
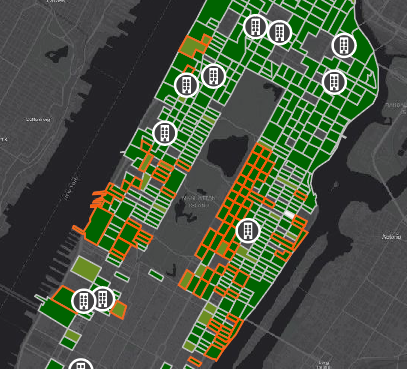
Next, add map data (artwork layers) to your map inside the compilation tab/window. The extension comes with default base map layers (we call basemaps). You can pick from image maps or vector layer - we recommend our Vector Streets Map (this basemap is great for “zoomed in”/large scale mapping). Or you can add other content from Esri’s cloud (ArcGIS Online) or your own local data (csv, txt or shp files).
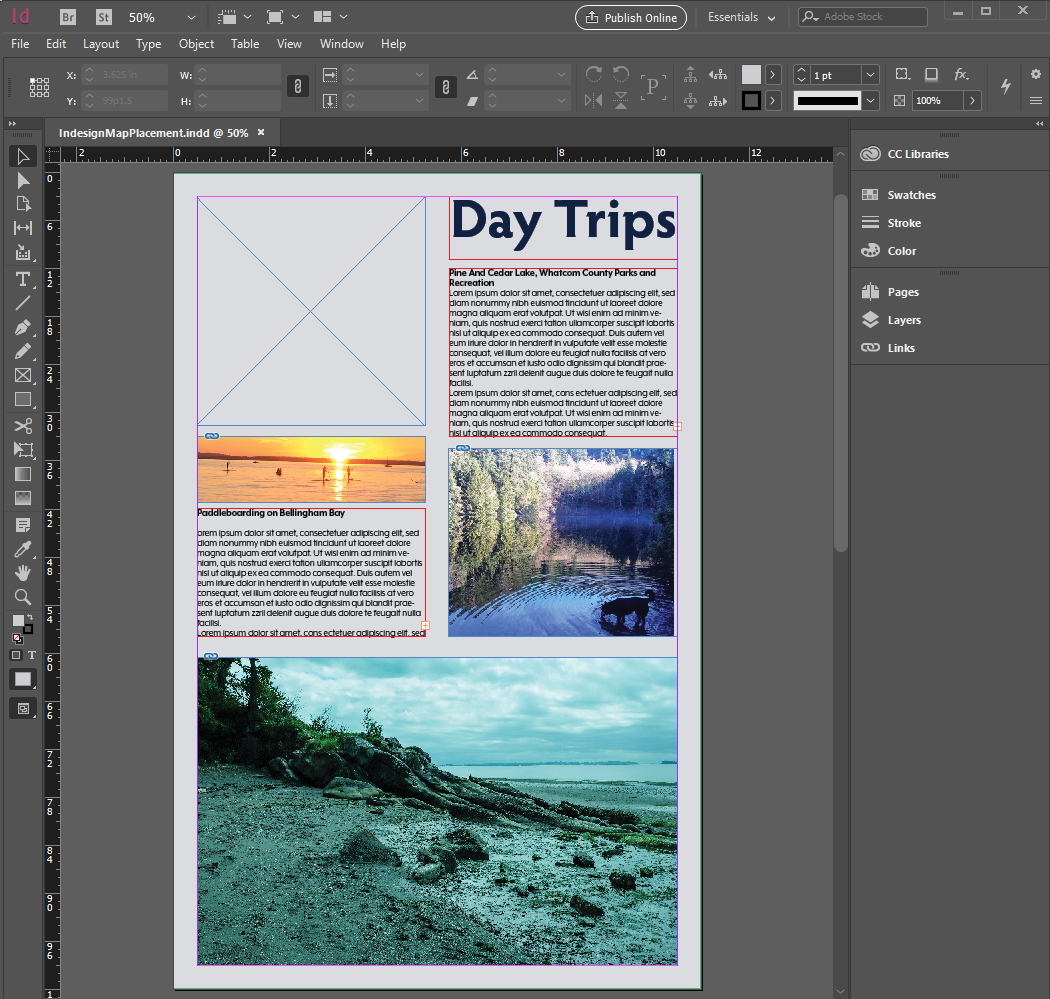
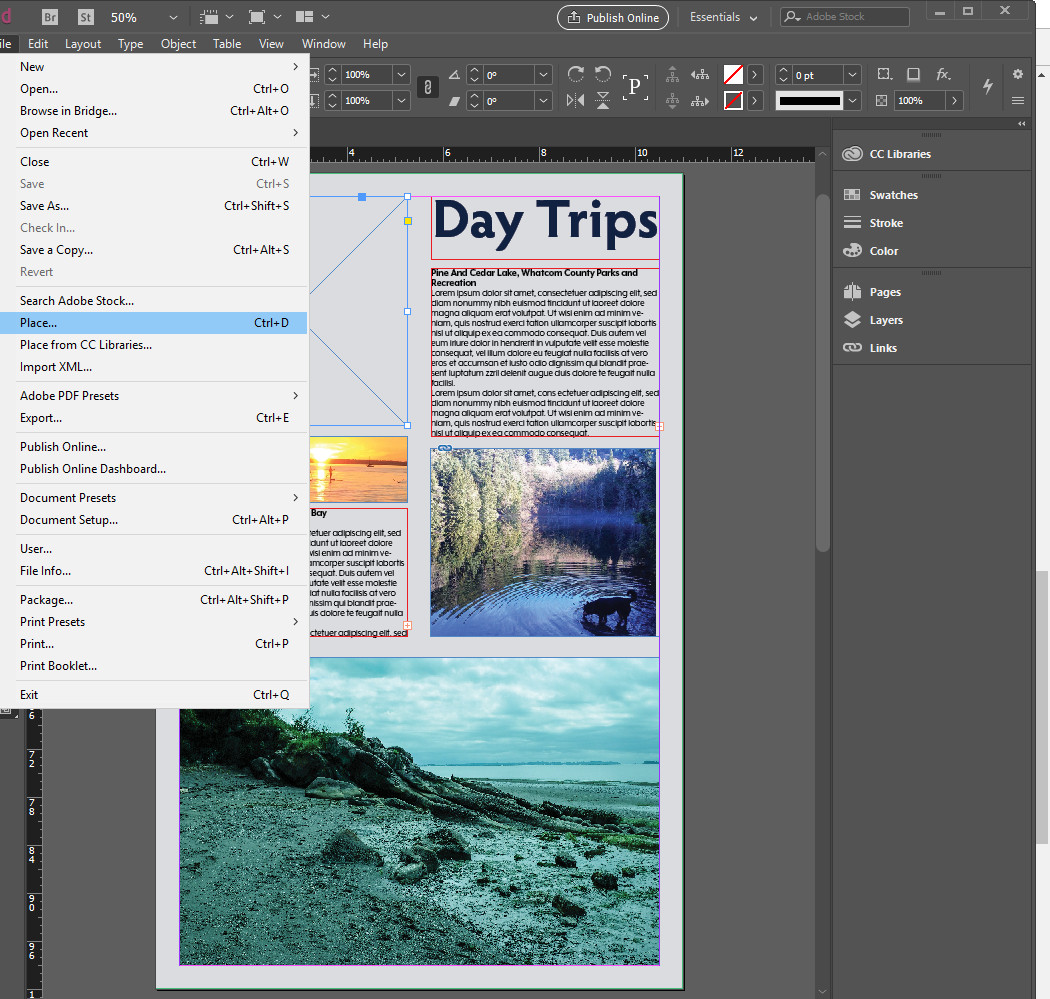
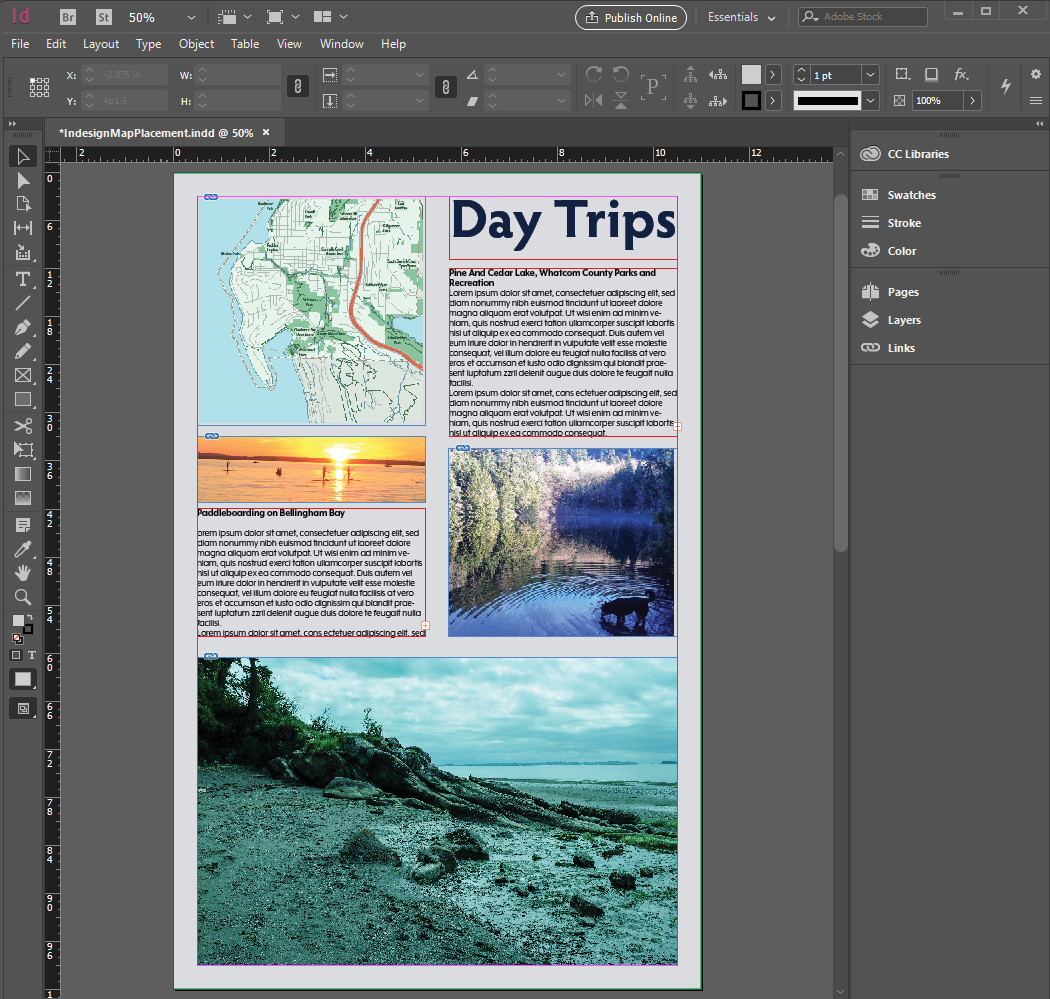
Lastly, download (sync) your map into Ai/Ps and design just as you would normally work.
Can you make maps of made up places (“fantasy maps”)?
Not directly, but many fantasy maps are based on real world places (eg. Lord of the Rings is based on the U.K.). So, you could download some of the standard data (artwork) and then
make your modifications and apply your design in Ai/Ps as a starting point, then even change the shape of places and add your own names. There is a map of Mars on the Maps We Love site (http://www.esri.com/products/maps-we-love) that outlines the steps on how that map was made.
Explore the “Life on Mars” Map: http://www.esri.com/products/maps-we-love/life-on-mars
What are the map credits?
They list the organizations/companies or people that provided the data used to make the map. It is good to give credit back to those organizations as the information provider. It’s encouraged, like in any report (e.g. school paper, presentations, web sites, etc.), to list your references when you are restating/siting/re-purposing someone else’s work.
How would an average creative (non-cartographer) use ArcGIS Maps for Adobe Creative Cloud?
After working and talking with many creatives, here are some of the typical reasons to make a map:
Infographics and Data Visualization
Storytelling (maps provide the setting for any story)
Sales/Marketing (where something is doing well vs. not)
Analytics
Design / Engineering / Architecture (CAD)
Product Advertising
Check out our presentation at Adobe MAX about this: https://video.tv.adobe.com/v/20036/
Where can I get more info on ArcGIS Maps for Adobe Creative Cloud and mapping?
Product Page: esri.com/m4cc
Install: https://exchange.adobe.com/addons/products/16913#.WdUZZRNSzGI
YouTube: https://www.youtube.com/playlist?list=PLGZUzt4E4O2K7MQjlQkM8D6z3E6DKkiOx
Esri Blog: https://blogs.esri.com/esri/arcgis/tag/adobe/
Adobe Blog: https://theblog.adobe.com/esris-arcgis-maps-integration-adobe-creative-cloud/
Documentation: http://doc.arcgis.com/en/maps-for-adobecc/
Geonet: https://community.esri.com/groups/arcgis-maps-for-adobe-creative-cloud
How to create a bar graph with text?
ArcGIS Pro is another software product Esri make that has the capability to do other types of data visualization graphs (e.g. bar graphs). You can export an SVG file out of ArcGIS Pro and place that into Ai, the bars and text are individual strokes, fills and text you can manipulate inside of Illustrator.
Can you bring in Google Maps data and add that to the other data from the ArcGIS Maps for Adobe extension?
Today you can convert a KML (keyhole markup language) to a shapefile, and add that data (artwork layers) to your map inside the compilation tab/window. We are planning to support a direct add of KML files in our next release.
How long has cartography been around?
Cartography has been around for a very long time. Wikipedia has an excellent background and history page to explore.
Cartography on Wikipedia: https://en.wikipedia.org/wiki/Cartography
Has satellite imagery killed manual (vector) mapping?
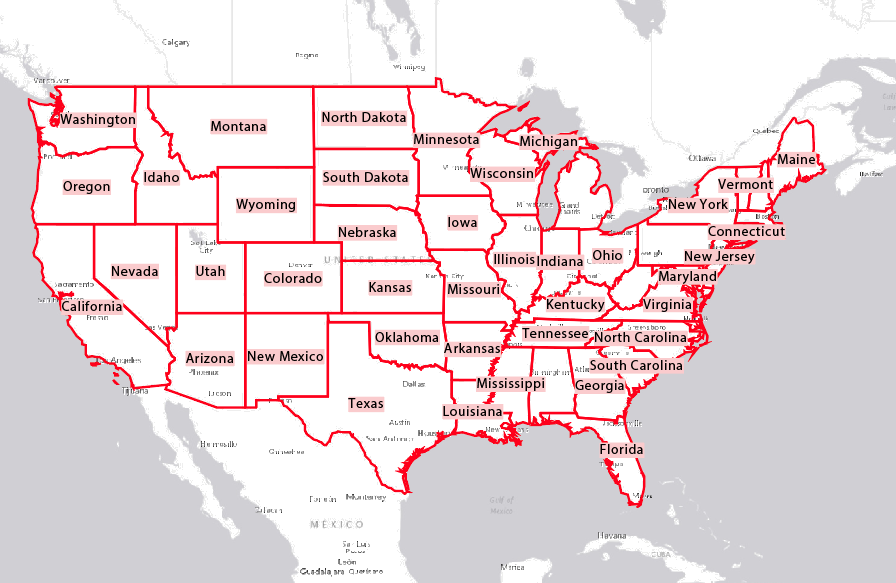
Satellite imagery is great and is a quick way to map a location. However, they don’t allow for stylizing, branding, or feature emphasis. Satellite imagery is image/raster based so there is a need or value for images in some workflows and vectors in others, just like Ai and Ps.
Are there any “best practices” or typical Map (design) “rules”?
Yes, there are design “rules” for making a map, and even college classes. Not unlike any specialized design field (e.g. color, type, website, UI, UX), there are conventions and best practices that the leaders in these fields highlight. The“Cartography.” book, highlights these with great visual examples and so does the Maps We Love web site.
However, a map, like any design project, is a creative process, and rules are made to be broken sometimes for better more effective communication or to make something stand out from the norm.
“Cartography.” Description: http://esripress.esri.com/display/index.cfm?fuseaction=display&websiteID=342&moduleID=0
Explore the Maps We Love: http://www.esri.com/products/maps-we-love
What’s Geocaching?
There’s an excellent website that outlines exactly what geocaching is. Check it out!
Learn more about geocaching: https://www.geocaching.com/guide/
Can you control the map projection in ArcGIS Maps for Adobe Creative Cloud?
Yes, if you are logged in using your ArcGIS Online account you can set the projection using the settings button before you download/sync.
http://doc.arcgis.com/en/maps-for-adobecc/compile-maps/layer-properties.htm
Can you make interactive “zoomable” maps?
ArcGIS Maps for Adobe extension is focused on making static image maps inside of Ai or Ps. There are other ArcGIS products that allow for the design and creation of interactive maps.
Explore our Platform: http://www.esri.com/arcgis/about-arcgis