- Home
- :
- All Communities
- :
- Products
- :
- Mapping and Charting Solutions
- :
- Mapping and Charting Questions
- :
- Re: Creating a color ramp between sample points
- Subscribe to RSS Feed
- Mark Topic as New
- Mark Topic as Read
- Float this Topic for Current User
- Bookmark
- Subscribe
- Mute
- Printer Friendly Page
- Mark as New
- Bookmark
- Subscribe
- Mute
- Subscribe to RSS Feed
- Permalink
Hello:
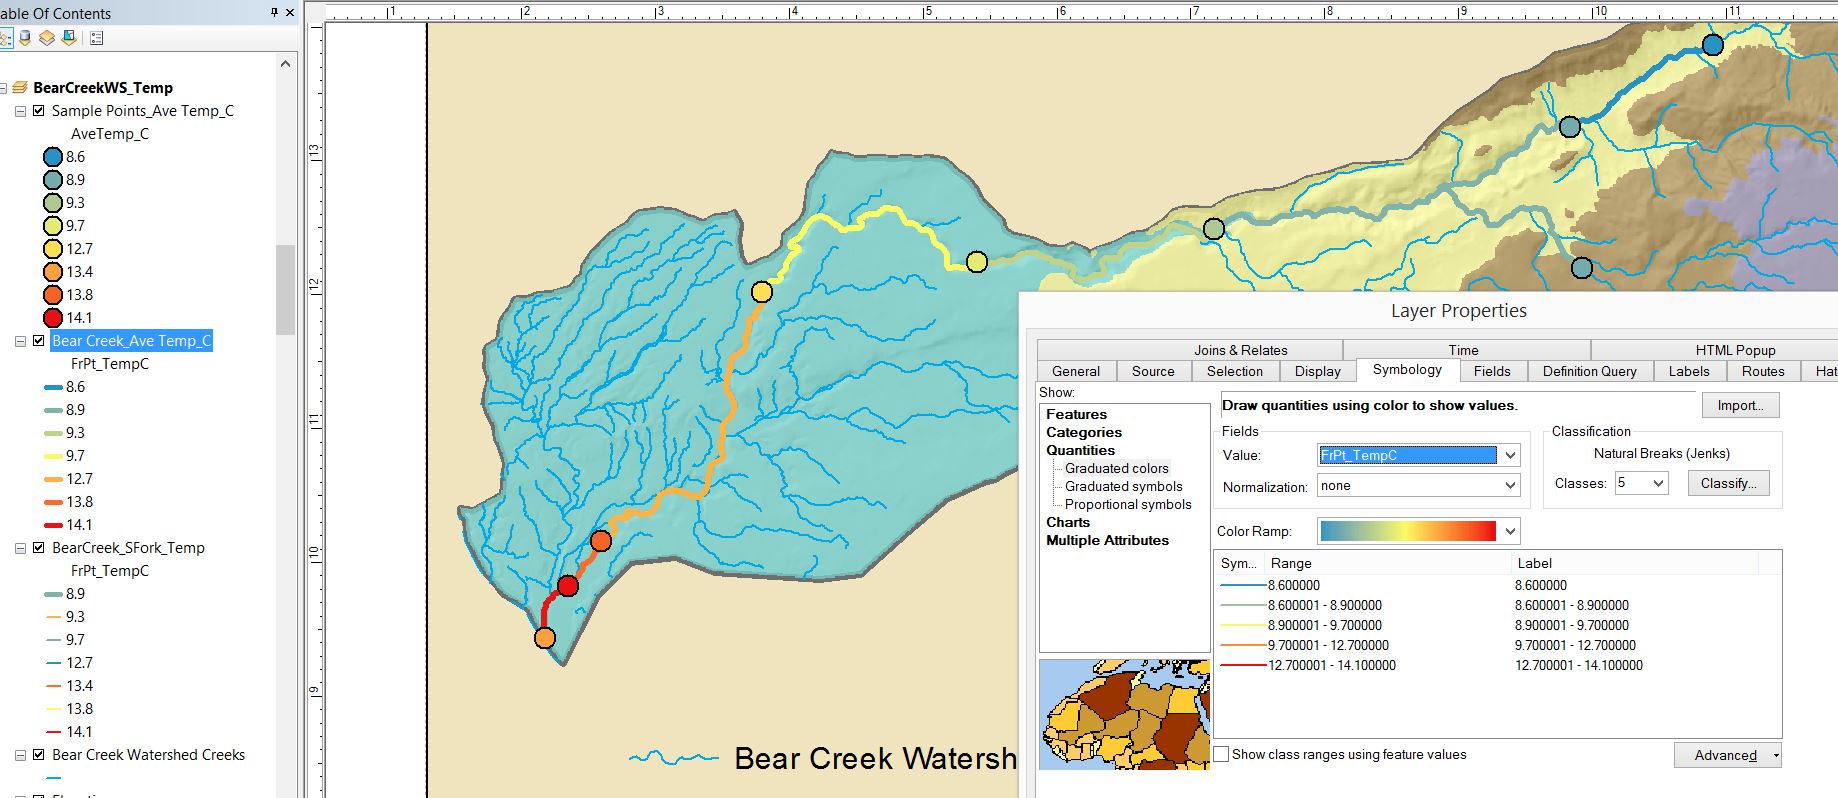
I am creating three maps on one poster. Each map depicts the same nine sample points along the same 26 mile reach of a creek. Each map is symbolized for one of the collected parameters, pH, temperature, and DO. Right now I have symbolized the reach between each point using the same color as the upstream sampling point. The color remains the same until the lower sampling point.
Is there a way to show change in color, a color ramp of sorts, between the two sample point. The change in color would need start the same as the up stream sample point and finish the same as the down stream point.
Thanks
Solved! Go to Solution.
Accepted Solutions
- Mark as New
- Bookmark
- Subscribe
- Mute
- Subscribe to RSS Feed
- Permalink
Oh, right. Well, if you think about it, these segments of line have discrete values, corresponding to the data point values, so how could ArcMap assign anything other than one color to each one. I guess the best is either what you have there, or a graduated line thickness to indicate the values.
- Mark as New
- Bookmark
- Subscribe
- Mute
- Subscribe to RSS Feed
- Permalink
Hi Melvin, yes, this is possible. Basically, the steps are:
- Right-click the line layer in the table of contents and click Properties.
- Click the Symbology tab.
- Click Quantities and click Graduated colors.
- Double-click the top symbol in the list and set the start color for the ramp.
- Click OK.
- Double-click the bottom symbol and set the end color.
- Click OK.
- Optionally, double-click any middle symbol to set its color. This lets you create a multipart color ramp.
- Right-click a symbol and click Ramp Colors.
- Click OK.
- Mark as New
- Bookmark
- Subscribe
- Mute
- Subscribe to RSS Feed
- Permalink
Sephe:
Thanks for the response. When I carried out these steps I did get a change in color from reach to reach (there are 8 "between point reaches" and they were different from each other) but each reach stayed the same from point to point, which is what I am hoping I can get to change in a color ramp sort of way.
Any thoughts on what I may be doing wrong or am I expecting tool much from the software?
Thanks
- Mark as New
- Bookmark
- Subscribe
- Mute
- Subscribe to RSS Feed
- Permalink
I am confident it can be done, but it would help to see a screenshot of your data to understand what you are trying to achieve.
- Mark as New
- Bookmark
- Subscribe
- Mute
- Subscribe to RSS Feed
- Permalink
What I'm imagining you'll need is a multipart color ramp, with seven middle colors set. Does that make sense?
- Mark as New
- Bookmark
- Subscribe
- Mute
- Subscribe to RSS Feed
- Permalink
Oh, right. Well, if you think about it, these segments of line have discrete values, corresponding to the data point values, so how could ArcMap assign anything other than one color to each one. I guess the best is either what you have there, or a graduated line thickness to indicate the values.
- Mark as New
- Bookmark
- Subscribe
- Mute
- Subscribe to RSS Feed
- Permalink
Sephe:
Thanks for your help.