- Home
- :
- All Communities
- :
- Products
- :
- Mapping and Charting Solutions
- :
- Mapping and Charting Questions
- :
- Re: ArcGIS 10 (Desktop) not displaying CSV datapoi...
- Subscribe to RSS Feed
- Mark Topic as New
- Mark Topic as Read
- Float this Topic for Current User
- Bookmark
- Subscribe
- Mute
- Printer Friendly Page
ArcGIS 10 (Desktop) not displaying CSV datapoint
- Mark as New
- Bookmark
- Subscribe
- Mute
- Subscribe to RSS Feed
- Permalink
Hi all,
I can't seem to get the attached CSV data points (which are Decimal Degree coordinates) to display on my map file (also attached). I've tried playing around with the long/lat columns, changing the projected system, and all to no avail. Really quite stuck now, so would be very grateful for some clarity as to where I'm going wrong.
Thanks!
Calum
- Mark as New
- Bookmark
- Subscribe
- Mute
- Subscribe to RSS Feed
- Permalink
I tried your data. and I have not any problem.

- Mark as New
- Bookmark
- Subscribe
- Mute
- Subscribe to RSS Feed
- Permalink
Hi Abdullah,
Thanks for the quick reply, and it's encouraging that you've got it working! I'm trying to display the points on top of the 'OA' layer in the main file (OAs are geographic areas, these ones focused on London). Are you able to do this at all? I've followed numerous tutorials, but without success, so I'd be really grateful if you could walk through how to do this.
Thanks again!
Calum
- Mark as New
- Bookmark
- Subscribe
- Mute
- Subscribe to RSS Feed
- Permalink
After you add points layer and define its spatial reference well, use Project—Help | ArcGIS Desktop tool for this layer to be same the 'OA' layer projection .
- Mark as New
- Bookmark
- Subscribe
- Mute
- Subscribe to RSS Feed
- Permalink
Apologies for my delay in replying. Unfortunately, this still isn't working. In terms of what I've done, I have:
1) Imported the geographic entity (here, OA layer)
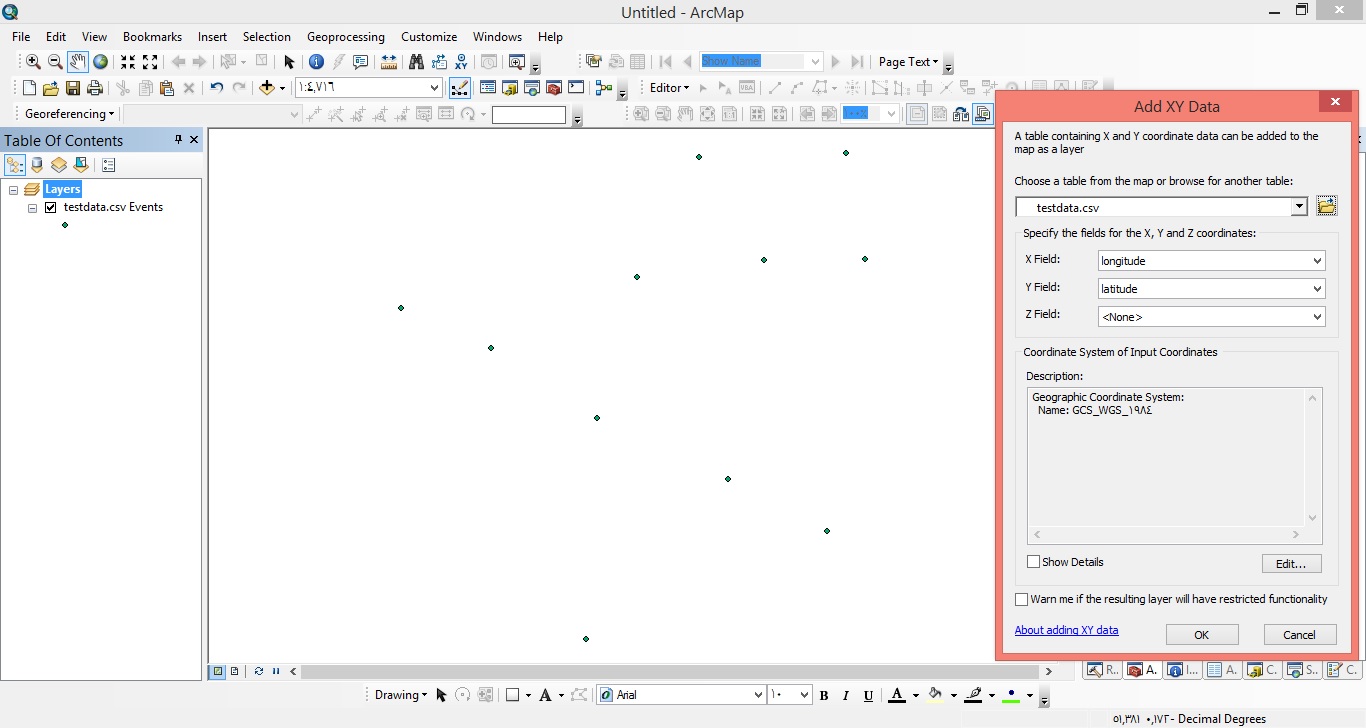
2) Added data (XY data) and defined the Long/Lat
3) Ensured that the projections are the same (using the Project tool)
However, the data does not display at all. What else could be happening here?
Thanks again for all of your help! It's really appreciated.
Calum
- Mark as New
- Bookmark
- Subscribe
- Mute
- Subscribe to RSS Feed
- Permalink
could you insert pictures for this problem?
- Mark as New
- Bookmark
- Subscribe
- Mute
- Subscribe to RSS Feed
- Permalink
Hi Calum,
When you added the xy data, you set the coordinate system to OSGB36? Or WGS 1984?
Ah, the longitude and latitude fields in the csv files are swapped. The -1 values should be labeled longitude and the 51 values are the latitude values.
If the OA data is really in British National Grid, you should set a transformation. Open data frame properties, coordinate system tab, transformations button.
Melita