- Home
- :
- All Communities
- :
- Products
- :
- ArcGIS Living Atlas of the World
- :
- Living Atlas Blog
- :
- Analysis using Living Atlas – Earthquake map Part ...
Analysis using Living Atlas – Earthquake map Part II
- Subscribe to RSS Feed
- Mark as New
- Mark as Read
- Bookmark
- Subscribe
- Printer Friendly Page
by Bern Szukalski
A recent post covered how to make an earthquake map quickly using ArcGIS Living Atlas of the World content. In Part II here, we’ll take our map a couple of steps further and use Living Atlas content plus geoenrichment and analysis tools to determine the total population impacted by a quake. In this case it was a minor quake, without any damage. Note that appropriate organization privileges are required to use analysis tools.
*
Where we left off…
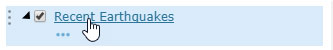
In the previous post we left off with our map showing the shake intensity and earthquake events by magnitude.

Shake intensity is one of the sublayers in the Recent Earthquakes layer. Click the arrow or layer name to reveal all the sublayers.
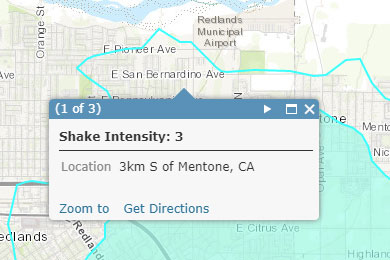
Opening the legend for the Shake Intensity sublayer, we can see that the intensity is displayed only if higher than III.

And if we click our map we can see that areas of III or less intensity are present, but not shaded.
*
The steps along the way
What we want to do is determine the total population that is within the area of Shake Intensity greater than III. We’ll not use ArcGIS Desktop or other tools, only ArcGIS Online capabilities along with Living Atlas content and tools. Our steps are outlined below:
1. Filter the Shake Intensity layer to only include areas greater than 3 in intensity.
2. Dissolve the boundaries by intensity level, so we can determine the total population impacted by each level.
3. Enrich the polygon with population data.
4. Finalize the map, and display the results.
*
Steps in detail
The steps outlined above, are presented below in detail.
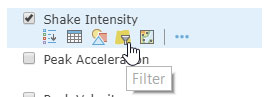
Step 1. Filter the Shake Intensity layer
Filter the Shake Intensity layer to include only polygons of greater than 3 in intensity. We had to do a little exploration, and discovered that intensity is stored numerically in the grid_code attribute.
Click Filter
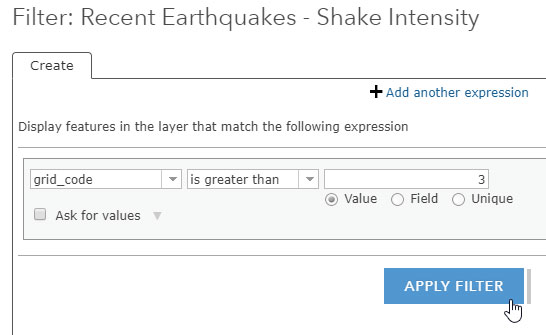
And construct the expression. In this case, filtering for all features where the grid_code is greater than 3. Click Apply Filter after completing the expression.
*
Step 2. Dissolve the boundaries by intensity level
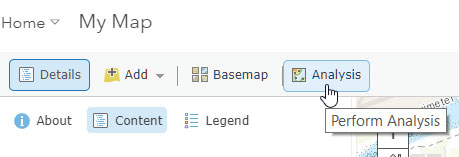
Click Perform Analysis
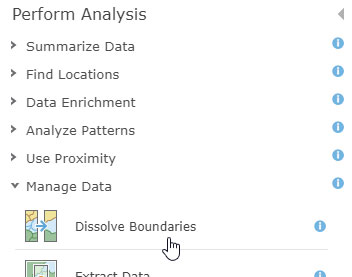
Then click Manage Data, and choose Dissolve Boundaries
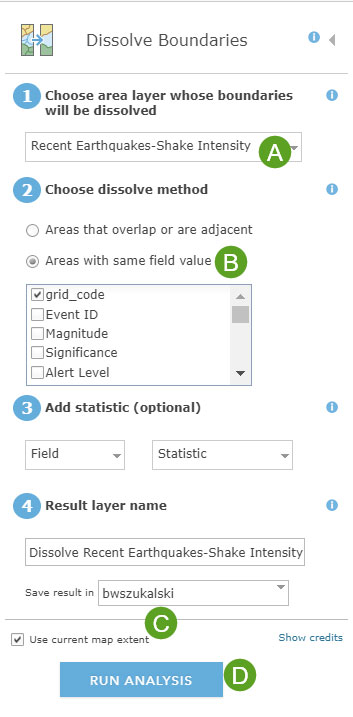
(A) Ensure the Shake Intensity sublayer is selected.
(B) Select Areas with same field value as the dissolve method, and choose the grid_code attribute (since we’ve determined that is where the intensity value is stored).
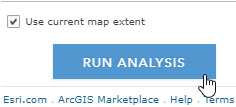
(C) Check the box to Use current map extent, since we want to limit our dissolve to just this one quake.
(D) Click Run Analysis.
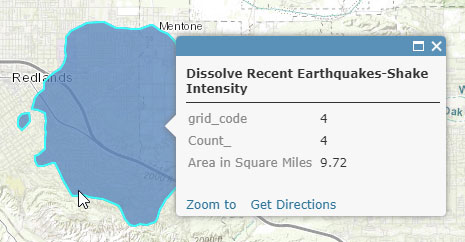
We now have a single area (since nothing was over 4 in intensity for this quake).
*
Step 3. Enrich the polygon with population data
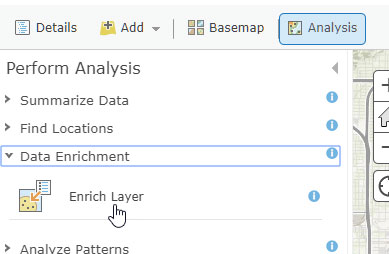
To determine the population within the area from Step 2. we can use the geoenrichment tools. Click Perform Analysis, choose Data Enrichment, then click Enrich Layer.
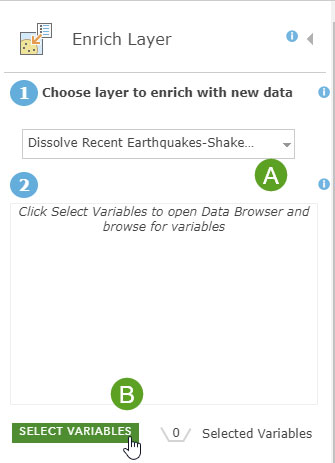
(A) Ensure the result layer of Step 2 is the layer to enrich.
(B) Click Select Variables.
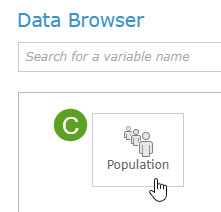
(C) Click Population
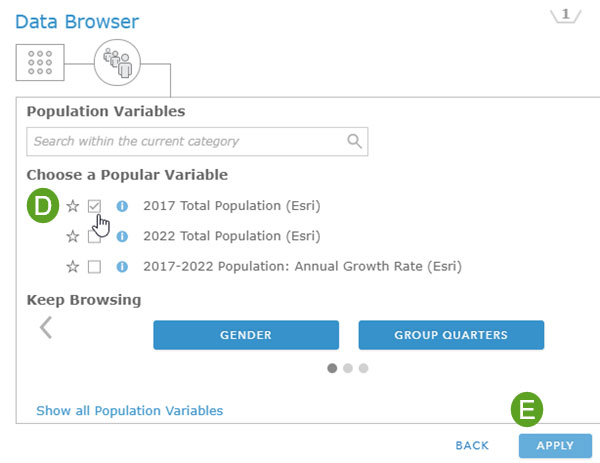
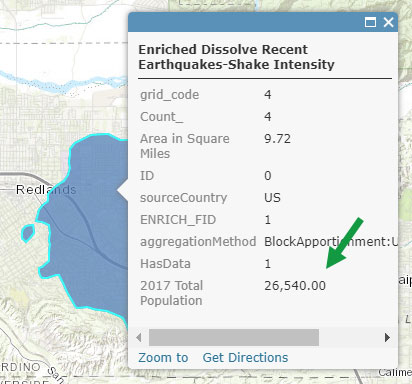
(D) Choose the 2017 total population variable.
(E) Click Apply
Back at the main Enrich Layer dialog, ensure that you’ve checked Use current map extent, then Run Analysis.
A new layer will be created that will include the population count.
*
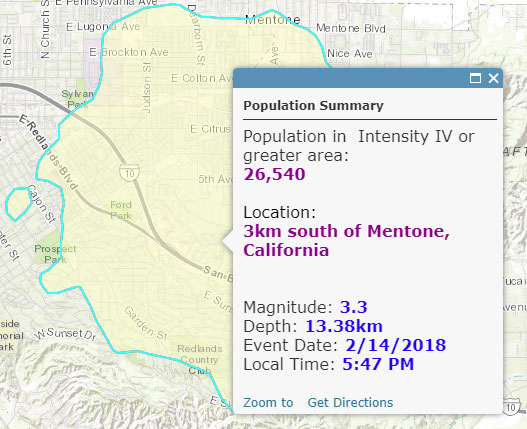
Step 5. Display the results
For our final step, all we need to do is finalize our map by removing unneeded layers and renaming the ones we want to keep, and configure the layer pop-up (shown below) to provide a more meaningful display of the results.
*
More information
For more information see the following :
You must be a registered user to add a comment. If you've already registered, sign in. Otherwise, register and sign in.