- Home
- :
- All Communities
- :
- Products
- :
- ArcGIS Living Atlas of the World
- :
- Living Atlas Blog
- :
- An earthquake map in 60 seconds using Living Atlas
An earthquake map in 60 seconds using Living Atlas
- Subscribe to RSS Feed
- Mark as New
- Mark as Read
- Bookmark
- Subscribe
- Printer Friendly Page
by Bern Szukalski
There I was… Sitting at the kitchen counter, with my laptop open and catching up on a few loose threads left over from a busy day. Then suddenly, bam! And then another, but more forceful, BAM! As if a large hand had slapped the side of the house. I knew immediately what it was, a familiar feeling living in Southern California. It was an earthquake. I knew it was close, but where?
I signed in to my ArcGIS account, opened the Map Viewer, and browsed the Living Atlas to search for earthquake feeds and layers to make a map to learn where the quake occurred.
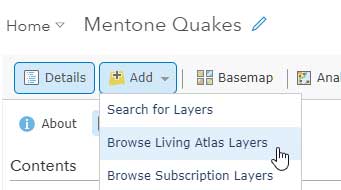
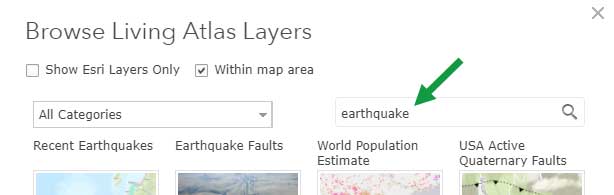
Typing in “earthquake” I quickly found the Living Atlas layers I wanted – Recent Earthquakes, Earthquake Faults, and Linear Earthquake Faults.
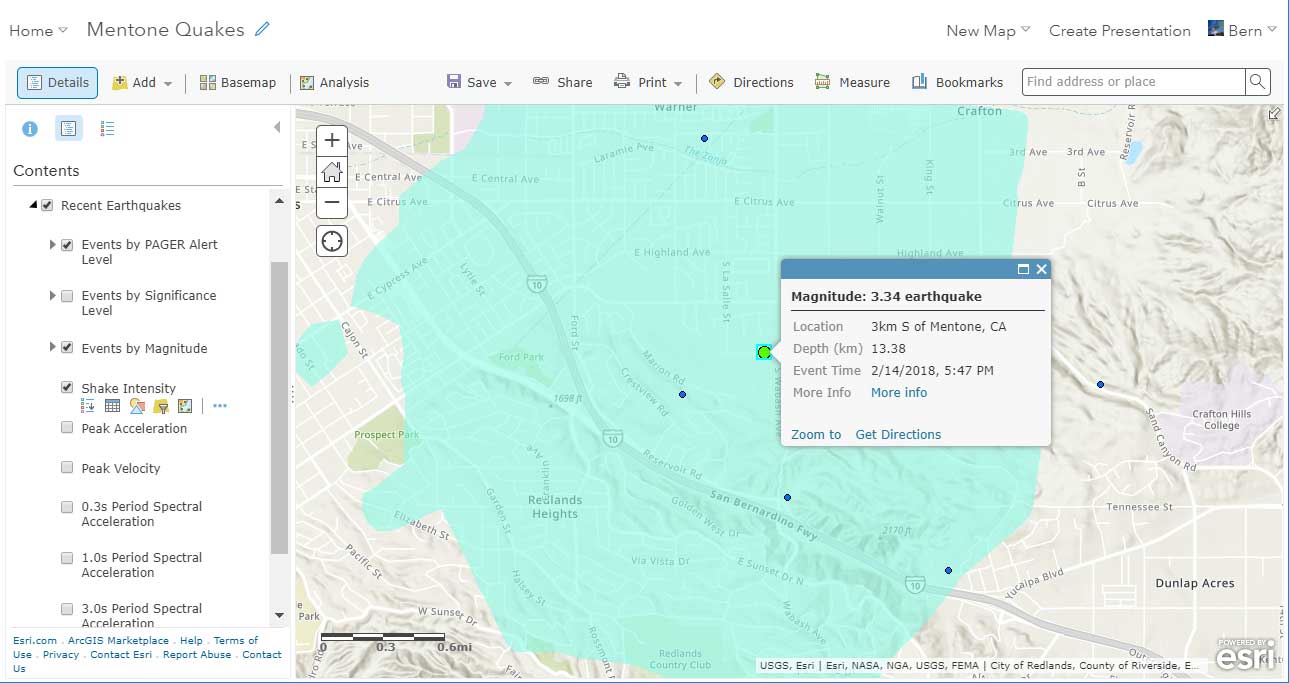
Turning on Recent Quakes, I quickly discovered where the quake happened, in the nearby community of Mentone, California. The colored area is the PAGER alert polygon automatically generated when significant seismic events occur.
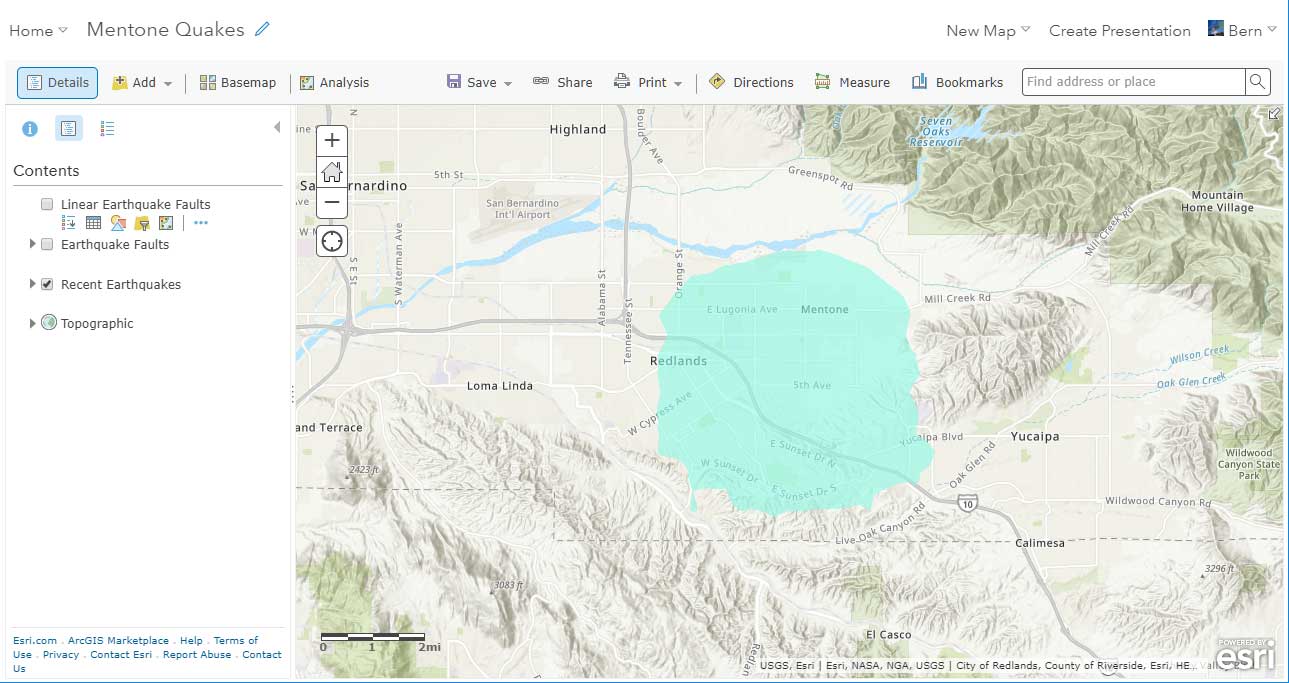
According to the USGS Earthquake site:
PAGER stands for the Prompt Assessment of Global Earthquakes for Response. It is an automated system that takes in seismic data from remote sensors in order to rapidly estimate earthquake shaking and the scope and impact of earthquakes around the world.
Next, I opened the Recent Earthquakes layer and turned on the Events by Magnitude sublayer.
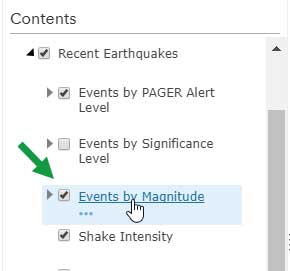
My map now showed the cluster of earthquakes, the two largest of which I felt. The largest one was Magnitude 3.34 – just a little nudge, but close enough to be felt.
I turned on the other layers to get some additional context about the nearby faults.
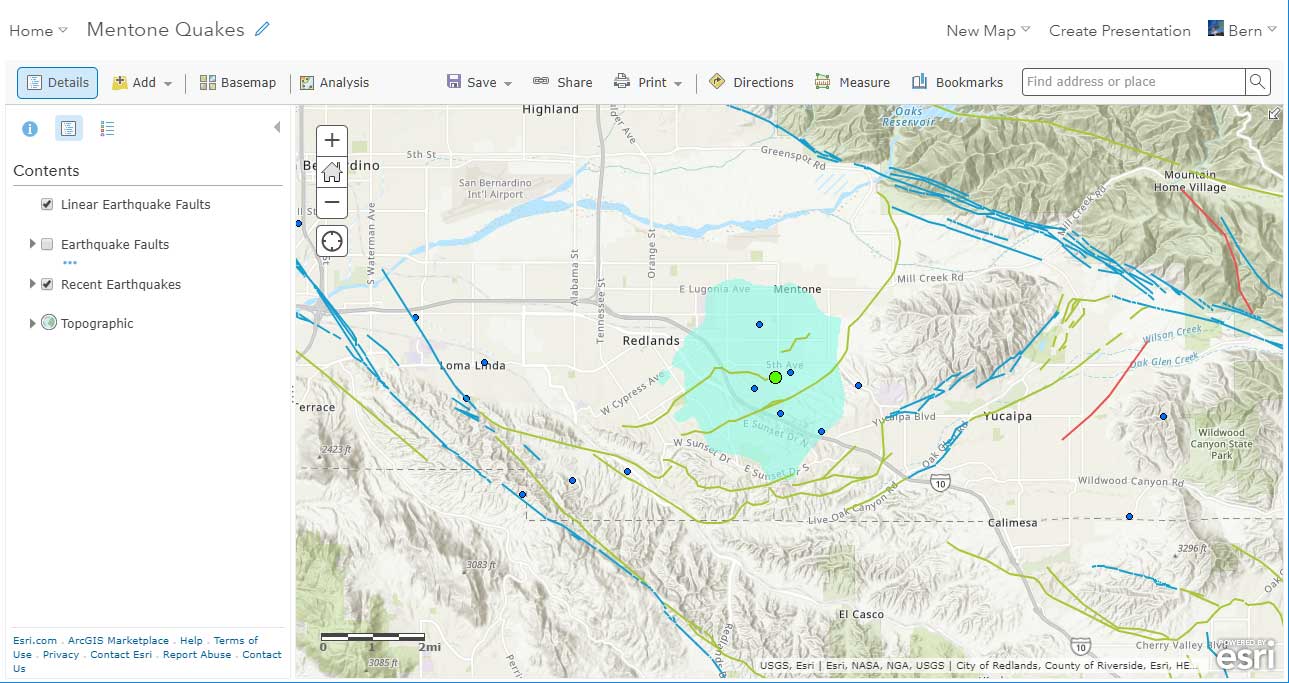
And discovered that this little cluster of temblors happened along the Redlands fault, in the Crafton Hills fault zone.
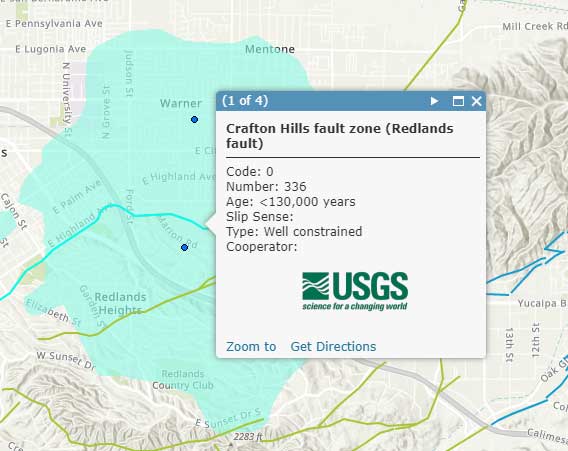
In just about a minute, I had my completed map of the quake, and knew a lot more than I did moments ago, thanks to the Living Atlas.
*
More information
For more information see the ArcGIS Living Atlas of the World website.
You must be a registered user to add a comment. If you've already registered, sign in. Otherwise, register and sign in.