- Home
- :
- All Communities
- :
- Developers
- :
- JavaScript Maps SDK
- :
- JavaScript Maps SDK Questions
- :
- Re: Spatial Intersection of geocoded points in JSA...
- Subscribe to RSS Feed
- Mark Topic as New
- Mark Topic as Read
- Float this Topic for Current User
- Bookmark
- Subscribe
- Mute
- Printer Friendly Page
Spatial Intersection of geocoded points in JSAPI
- Mark as New
- Bookmark
- Subscribe
- Mute
- Subscribe to RSS Feed
- Permalink
I would like to create a simple ArcGIS Online web-map or ArcGIS JSAPI application that contains one polygon layer with attributes and a locator. I would like to drop a pin or point on my geocode result and display the attributes of the polygon that it falls within. Are there any examples of this available? The best that I could do was the point in polygon selection, but I would like to create a feature layer from my geocoded location and give it the same attributes of the polygon it falls within. I am using this for voting districts. So if I am at 1000 N. Broadway Blvd. and geocode that then, the point that appears on the map should be given the attributes of District 1, for example.
Solved! Go to Solution.
Accepted Solutions
- Mark as New
- Bookmark
- Subscribe
- Mute
- Subscribe to RSS Feed
- Permalink
Geoffery,
Here is the sample updated to not display the search widgets popup but instead trigger the layers standard popup.
<!DOCTYPE html>
<html>

<head>
  <meta http-equiv="Content-Type" content="text/html; charset=utf-8">
  <meta name="viewport" content="initial-scale=1, maximum-scale=1,user-scalable=no">
  <title>Create web map from id</title>

  <link rel="stylesheet" href="http://js.arcgis.com/3.16/dijit/themes/claro/claro.css">
  <link rel="stylesheet" href="http://js.arcgis.com/3.16/esri/css/esri.css">
  <link rel="stylesheet" href="css/layout.css">

  <style>
    html,
    body {
      height: 100%;
      width: 100%;
      margin: 0;
      padding: 0;
    }

    body {
      background-color: #FFF;
      overflow: hidden;
      font-family: "Helvetica";
    }

    #header {
      border: solid 1px #A8A8A8;
      overflow: hidden;
      background-color: #999;
      background: -webkit-gradient(linear, left top, left bottom, from(#fff), to(#C0C0C0));
      background: -moz-linear-gradient(top, #fff, #C0C0C0);
      height: 65px;
      margin: 5px 5px;
    }

    .roundedCorners {
      -o-border-radius: 4px;
      -moz-border-radius: 4px;
      -webkit-border-radius: 4px;
      border-radius: 4px;
    }

    .shadow {
      -webkit-box-shadow: 4px 4px 8px #adadad;
      -moz-box-shadow: 4px 4px 8px #adadad;
      -o-box-shadow: 4px 4px 8px #adadad;
      box-shadow: 4px 4px 8px #adadad;
    }

    #title {
      padding-top: 2px;
      padding-left: 10px;
      color: #000;
      font-size: 18pt;
      text-align: left;
      text-shadow: 0px 1px 0px #e5e5ee;
      font-weight: 700;
    }

    #subtitle {
      font-size: small;
      padding-left: 40px;
      text-shadow: 0px 1px 0px #e5e5ee;
      color: #000;
    }

    #rightPane {
      background-color: #E8E8E8;
      border: solid 2px #B8B8B8;
      margin: 5px;
      width: 20%;
    }

    #map {
      background-color: #FFF;
      border: solid 2px #B8B8B8;
      margin: 5px;
      padding: 0;
    }

    .esriLegendServiceLabel {
      display: none;
    }

    #search {
      display: block;
      position: absolute;
      z-index: 2;
      top: 140px;
      left: 74px;
    }
  </style>

  <script src="http://js.arcgis.com/3.16/"></script>
  <script>
    require([
        "dojo/parser",
        "dojo/ready",
        "dijit/layout/BorderContainer",
        "dijit/layout/ContentPane",
        "dojo/dom",
        "esri/map",
        "esri/urlUtils",
        "esri/arcgis/utils",
        "esri/dijit/Legend",
        "esri/dijit/Scalebar",
        "esri/dijit/Search",
        "dojo/on",
        "dojo/_base/lang",
        "esri/tasks/query",
        "esri/tasks/QueryTask",
        "dojo/domReady!"
      ], function (
      parser,
      ready,
      BorderContainer,
      ContentPane,
      dom,
      Map,
      urlUtils,
      arcgisUtils,
      Legend,
      Scalebar,
      Search,
      on,
      lang,
      Query,
      QueryTask
    ) {
      ready(function () {

        parser.parse();

        //if accessing webmap from a portal outside of ArcGIS Online, uncomment and replace path with portal URL
        //arcgisUtils.arcgisUrl = "https://pathto/portal/sharing/content/items";
        arcgisUtils.createMap("a95d21a0d6bd4d42b96b88acdd910b49", "map").then(function (response) {
          //update the app
          dom.byId("title").innerHTML = response.itemInfo.item.title;
          dom.byId("subtitle").innerHTML = response.itemInfo.item.snippet;

          var map = response.map;

          //add the scalebar
          var scalebar = new Scalebar({
            map: map,
            scalebarUnit: "english"
          });

          var search = new Search({
            map: map,
            enableInfoWindow: false
          }, "search");
          search.startup();

          search.on("select-result", lang.hitch(this, function(result){
            var geom = result.result.feature.geometry;
            var queryTask = new QueryTask("http://services.arcgis.com/P3ePLMYs2RVChkJx/arcgis/rest/services/USA_ZIP_Codes/FeatureServer/0");
            var query = new Query();
            query.returnGeometry = true;
            query.outFields = ["*"];
            query.geometry = geom;
            queryTask.execute(query, lang.hitch(this, function(results){
              //here are the attributes of the zip poly that the search widgets results intersected.
              console.info(results.features[0].attributes);
              var scrPt = map.toScreen(geom);
              map.emit("click", { bubbles: true, cancelable: true, screenPoint: scrPt, mapPoint: geom });
            }));
          }));

          //add the legend. Note that we use the utility method getLegendLayers to get
          //the layers to display in the legend from the createMap response.
          var legendLayers = arcgisUtils.getLegendLayers(response);
          var legendDijit = new Legend({
            map: map,
            layerInfos: legendLayers
          }, "legend");
          legendDijit.startup();
        });
      });
    });
  </script>
</head>

<body class="claro">
  <div id="mainWindow" data-dojo-type="dijit/layout/BorderContainer" data-dojo-props="design:'headline'" style="width:100%; height:100%;">
    <div id="header" class="shadow roundedCorners" data-dojo-type="dijit/layout/ContentPane" data-dojo-props="region:'top'">
      <div id="title"></div>
      <div id="subtitle"></div>
    </div>
    <div id="map" class="roundedCorners shadow" data-dojo-type="dijit/layout/ContentPane" data-dojo-props="region:'center'"></div>
    <div id="search"></div>
    <div id="rightPane" class="roundedCorners shadow" data-dojo-type="dijit/layout/ContentPane" data-dojo-props="region:'right'">
      <div id="legend"></div>
    </div>
  </div>
</body>

</html>
- Mark as New
- Bookmark
- Subscribe
- Mute
- Subscribe to RSS Feed
- Permalink
Geoffery,
Here is a sample to get you started:
<!DOCTYPE html>
<html>

<head>
  <meta http-equiv="Content-Type" content="text/html; charset=utf-8">
  <meta name="viewport" content="initial-scale=1, maximum-scale=1,user-scalable=no">
  <title>Create web map from id</title>

  <link rel="stylesheet" href="https://js.arcgis.com/3.16/dijit/themes/claro/claro.css">
  <link rel="stylesheet" href="https://js.arcgis.com/3.16/esri/css/esri.css">

  <style>
    html,
    body {
      height: 100%;
      width: 100%;
      margin: 0;
      padding: 0;
    }

    body {
      background-color: #FFF;
      overflow: hidden;
      font-family: "Helvetica";
    }

    #header {
      border: solid 1px #A8A8A8;
      overflow: hidden;
      background-color: #999;
      background: -webkit-gradient(linear, left top, left bottom, from(#fff), to(#C0C0C0));
      background: -moz-linear-gradient(top, #fff, #C0C0C0);
      height: 65px;
      margin: 5px 5px;
    }

    .roundedCorners {
      -o-border-radius: 4px;
      -moz-border-radius: 4px;
      -webkit-border-radius: 4px;
      border-radius: 4px;
    }

    .shadw {
      -webkit-box-shadow: 4px 4px 8px #adadad;
      -moz-box-shadow: 4px 4px 8px #adadad;
      -o-box-shadow: 4px 4px 8px #adadad;
      box-shadow: 4px 4px 8px #adadad;
    }

    #title {
      padding-top: 2px;
      padding-left: 10px;
      color: #000;
      font-size: 18pt;
      text-align: left;
      text-shadow: 0px 1px 0px #e5e5ee;
      font-weight: 700;
    }

    #subtitle {
      font-size: small;
      padding-left: 40px;
      text-shadow: 0px 1px 0px #e5e5ee;
      color: #000;
    }

    #rightPane {
      background-color: #E8E8E8;
      border: solid 2px #B8B8B8;
      margin: 5px;
      width: 20%;
    }

    #map {
      background-color: #FFF;
      border: solid 2px #B8B8B8;
      margin: 5px;
      padding: 0;
    }

    .esriLegendServiceLabel {
      display: none;
    }

    #search {
      display: block;
      position: absolute;
      z-index: 2;
      top: 140px;
      left: 74px;
    }
  </style>

  <script src="https://js.arcgis.com/3.16/"></script>
  <script>
    require([
        "dojo/parser",
        "dojo/ready",
        "dijit/layout/BorderContainer",
        "dijit/layout/ContentPane",
        "dojo/dom",
        "esri/map",
        "esri/urlUtils",
        "esri/arcgis/utils",
        "esri/dijit/Legend",
        "esri/dijit/Scalebar",
        "esri/dijit/Search",
        "dojo/on",
        "dojo/_base/lang",
        "esri/tasks/query",
        "esri/tasks/QueryTask",
        "dojo/domReady!"
      ], function (
      parser,
      ready,
      BorderContainer,
      ContentPane,
      dom,
      Map,
      urlUtils,
      arcgisUtils,
      Legend,
      Scalebar,
      Search,
      on,
      lang,
      Query,
      QueryTask
    ) {
      ready(function () {
        parser.parse();

        //if accessing webmap from a portal outside of ArcGIS Online, uncomment and replace path with portal URL
        //arcgisUtils.arcgisUrl = "https://pathto/portal/sharing/content/items";
        arcgisUtils.createMap("a95d21a0d6bd4d42b96b88acdd910b49", "map").then(function (response) {
          //update the app
          dom.byId("title").innerHTML = response.itemInfo.item.title;
          dom.byId("subtitle").innerHTML = response.itemInfo.item.snippet;

          var ap = response.map;

          //add the scalebar
          var scalebar = new Scalebar({
            map: map,
            scalebarUnit: "english"
          });

          var search = new Search({
            map: map
          }, "search");
          search.startup();

          search.on("select-result", lang.hitch(this, function(result){
            var geom = result.result.feature.geometry;
            var queryTask = new QueryTask("http://services.arcgis.com/P3ePLMYs2RVChkJx/arcgis/rest/services/USA_ZIP_Codes/FeatureServer/0");
            var query = new Query();
            query.returnGeometry = true;
            query.outFields = ["*"];
            query.geometry = geom;
            queryTask.execute(query, lang.hitch(this, function(results){
              //here are the attributes of the zip poly that the search widgets results intersected.
              console.info(results.features[0].attributes);
            }));
          }));

          //add the legend. Note that we use the utility method getLegendLayers to get
          //the layers to display in the legend from the createMap response.
          var legendLayers = arcgisUtils.getLegendLayers(response);
          var legendDijit = new Legend({
            map: map,
            layerInfos: legendLayers
          }, "legend");
          legendDijit.startup();
        });
      });
    });
  </script>
</head>

<body class="claro">
  <div id="mainWindow" data-dojo-type="dijit/layout/BorderContainer" data-dojo-props="design:'headline'" style="width:100%; height:100%;">
    <div id="header" class="shadow roundedCorners" data-dojo-type="dijit/layout/ContentPane" data-dojo-props="region:'top'">
      <div id="title"></div>
      <div id="subtitle"></div>
    </div>
    <div id="map" class="roundedCorners shadow" data-dojo-type="dijit/layout/ContentPane" data-dojo-props="region:'center'"></div>
    <div id="search"></div>
    <div id="rightPane" class="roundedCorners shadow" data-dojo-type="dijit/layout/ContentPane" data-dojo-props="region:'right'">
      <div id="legend"></div>
    </div>
  </div>
</body>

</html>
- Mark as New
- Bookmark
- Subscribe
- Mute
- Subscribe to RSS Feed
- Permalink
Hi Robert,
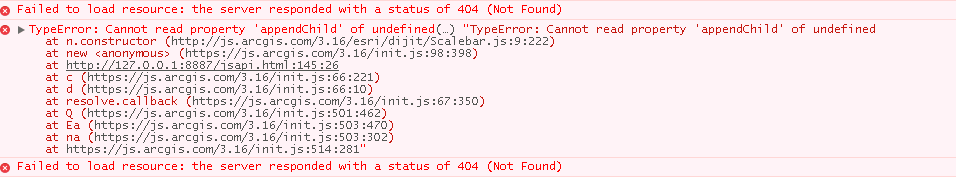
Thanks for your response, I have configured this application on a local machine using the Chrome Add-On 200 OK to launch it and avoid cross origin domain errors. However, I have received the errors below in the console. What is the solution for this?
- Mark as New
- Bookmark
- Subscribe
- Mute
- Subscribe to RSS Feed
- Permalink
Geoffery,
It looks like you are having issues resolving the esri JS API urls. I just tested with Chrome Add-On 200 OK and had no issue so I am not sure what to tell you.
- Mark as New
- Bookmark
- Subscribe
- Mute
- Subscribe to RSS Feed
- Permalink
I have tried debugging it; removing the scale bar and changing the legend, it seems that it's getting hung up in either of these functions.
- Mark as New
- Bookmark
- Subscribe
- Mute
- Subscribe to RSS Feed
- Permalink
Geoffery,
Do you have a true web server on your machine? If so I would recommend adding the html page to your standard web server and test there.
- Mark as New
- Bookmark
- Subscribe
- Mute
- Subscribe to RSS Feed
- Permalink
I have done so, and am still receiving the same errors. I am debugging now
by stepping through the legend and scale bar functions.
On Fri, Mar 11, 2016 at 9:37 AM, Robert Scheitlin, GISP <[email protected]>
- Mark as New
- Bookmark
- Subscribe
- Mute
- Subscribe to RSS Feed
- Permalink
Geoffery,
That is very strange as I have that exact sample code running on my machine without issue. Is your network environment blocking the esri urls? Are you running from the file system or actually using localhost or machine name url?
- Mark as New
- Bookmark
- Subscribe
- Mute
- Subscribe to RSS Feed
- Permalink
I am running using localhost, I set up a virtual directory in IIS 6. Now
that I think of it, JSAPI 3.16 probably requires 4.5 .NET, I am on 3.5.
Would this cause the error?
On Fri, Mar 11, 2016 at 9:56 AM, Robert Scheitlin, GISP <[email protected]>
- Mark as New
- Bookmark
- Subscribe
- Mute
- Subscribe to RSS Feed
- Permalink
Geoffery,
There is no .Net dependency at all using the JS API. Can you just test this urls by pasting it into your browsers address bar:
https://js.arcgis.com/3.16/dijit/themes/claro/claro.css
Do you get access to the above link or do you get an error?